Documentation
Getting started
DOM and Chart
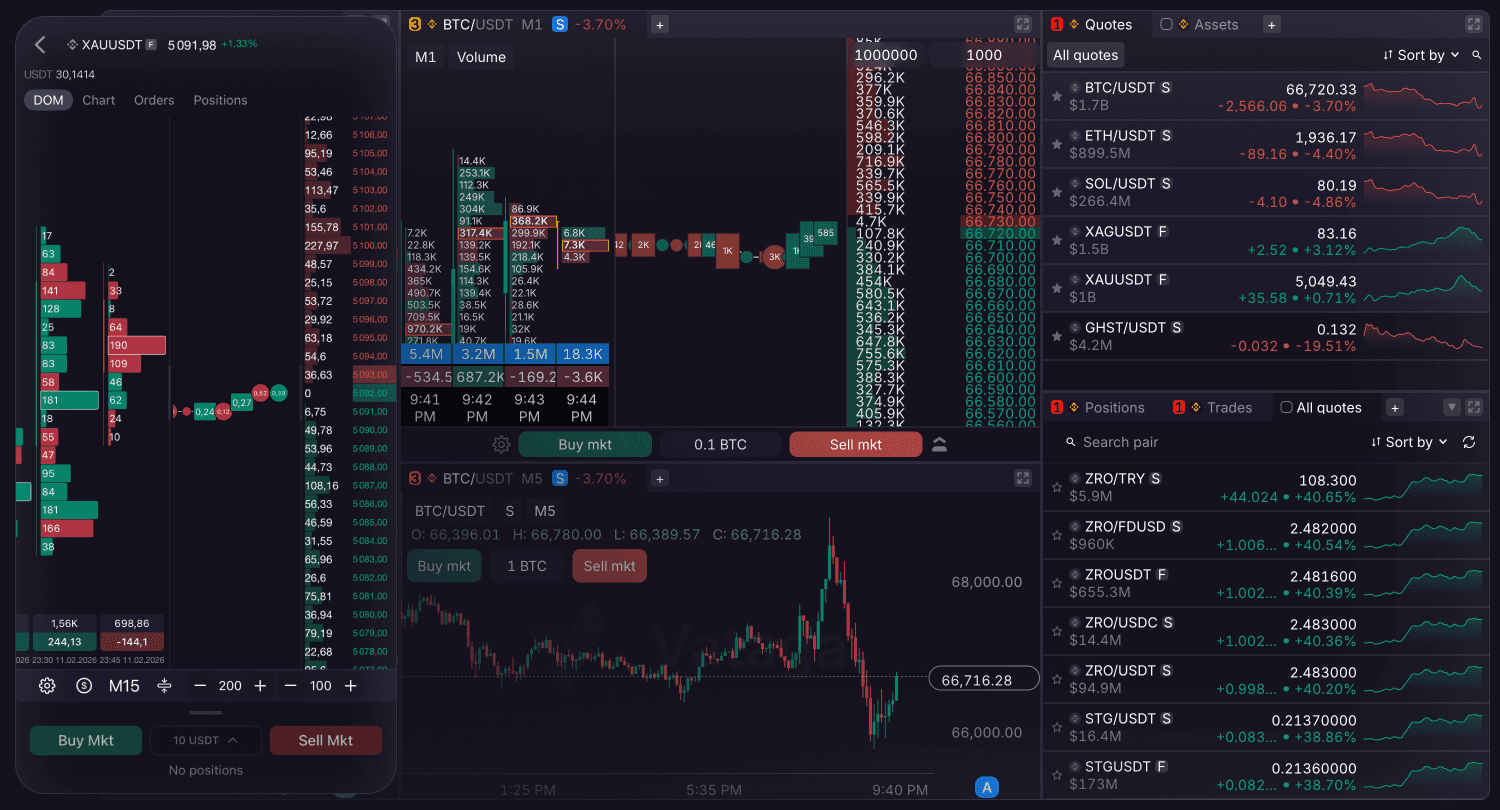
The terminal provides a unified interface for trading and real-time liquidity monitoring.
Chart
Dedicated to technical analysis and tracking price movements or open orders and positions. The chart has timeframes from 1 month down to 15 seconds.
DOM
Primary trading environment, integrating three data streams in a single view:
Clusters: Visualize historical traded volume at each price level to identify significant buying or selling zones. The terminal ensures high-performance cluster processing in Volume and Bid x Ask.
Order Book: The list of buy and sell orders (Bids/Asks), displaying real-time liquidity by price levels. The Ask side (Sell liquidity) is at the top in red, and the Bid side (Buy liquidity) is at the bottom in green.
Trades Feed: A live stream of individual executed market transactions, indicating immediate market momentum.
Liquidity Visualization
Horizontal bars represent volume at price levels. Bar length indicates the relative strength of interest.
You can customize the bar fill settings.
You can also choose to display DOM volumes in either base or quote currency.
Leverage and Buying Power
Your current leverage is displayed continuously at the top of the pair screen, right next to the balance or pair name. Tapping this leverage value opens a quick-adjustment slider.
Additionally, the dashboard displays your Buying Power — the actual amount available for placing orders. This is calculated as your available balance multiplied by your leverage. Adjusting the leverage slider will recalculate and display your new potential buying power.
Volume Histogram Fill Settings
You can dynamically adjust the visual density of the order book using the volume histogram slider. Tapping the setting opens a pop-up slider that allows you to change the maximum fill value in real-time in the DOM.
Note: When the DOM is set to display values in the quote currency (using the [$] button), the histogram fill scale is automatically calculated and displayed based on the quote currency.