

Introduction
If you've ever watched a stock price bounce up and down like a tennis ball, you've witnessed support and resistance in action. These two concepts are among the most valuable tools traders use to make sense of market movements and decide when to buy or sell.
Let's break down what these levels mean and how you can use them in your trading strategy.
The Basics: What Are We Talking About?
Think of support and resistance as invisible boundaries that influence price behavior. They're not physical barriers, but they act like psychological checkpoints where traders collectively change their minds about value.
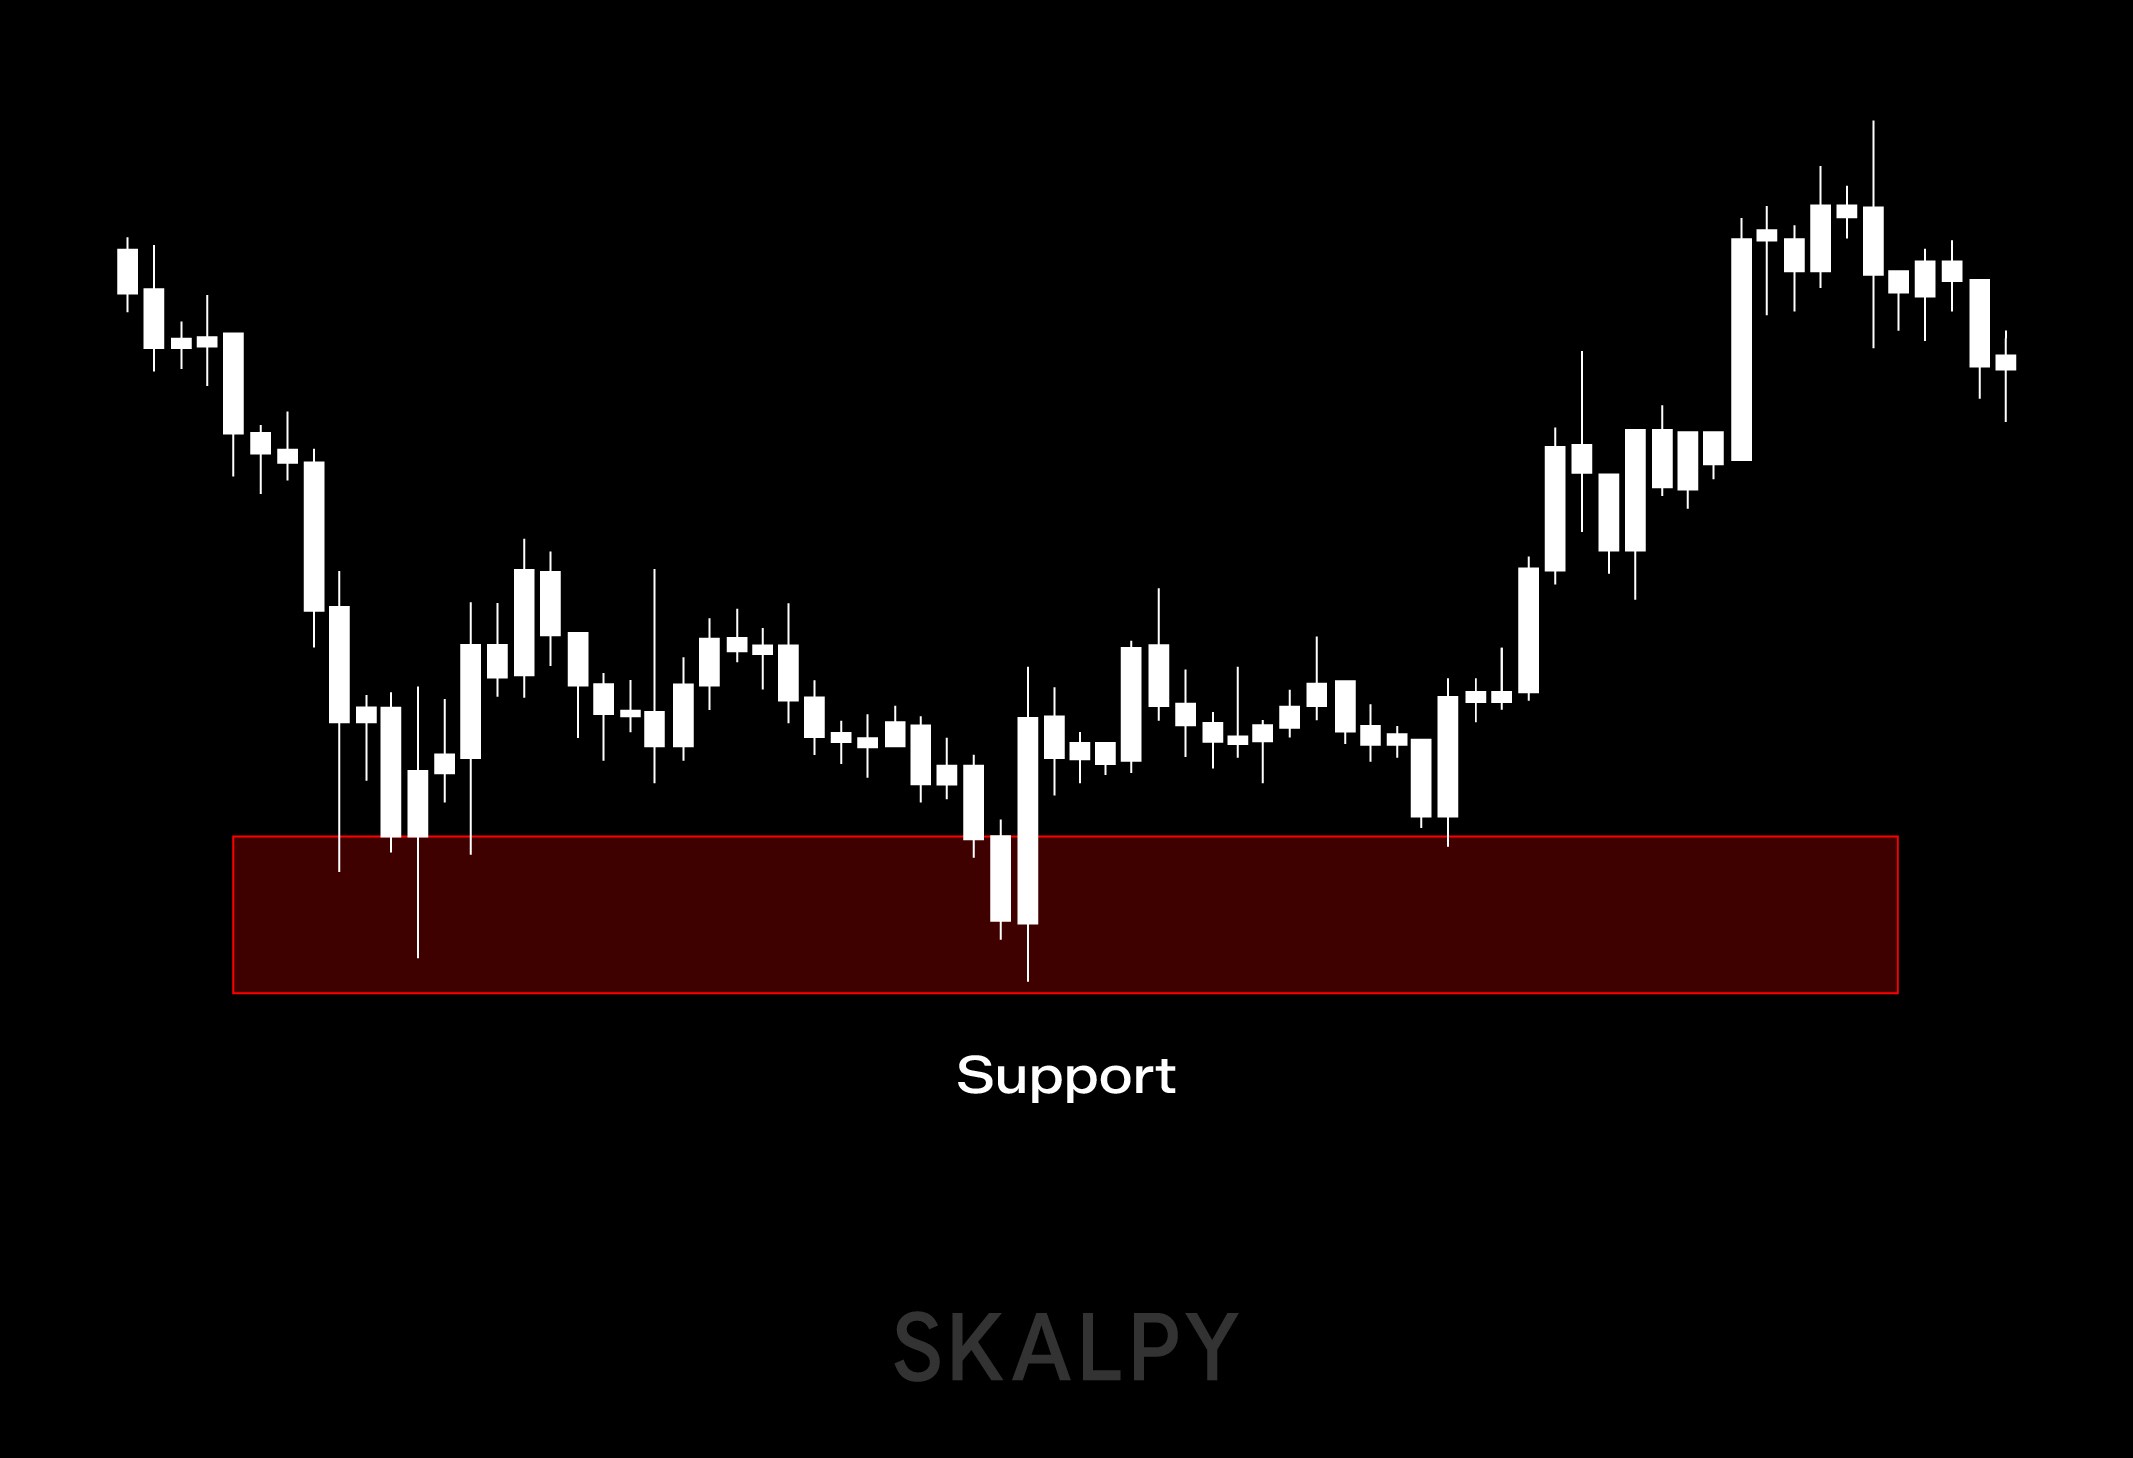
Support is like a safety net under a falling price. Imagine a stock dropping from $100 to $80, then to $60. Somewhere along that journey, let's say at $50, enough buyers decide the price looks attractive. They start purchasing, creating demand that stops the decline. That $50 level becomes support.
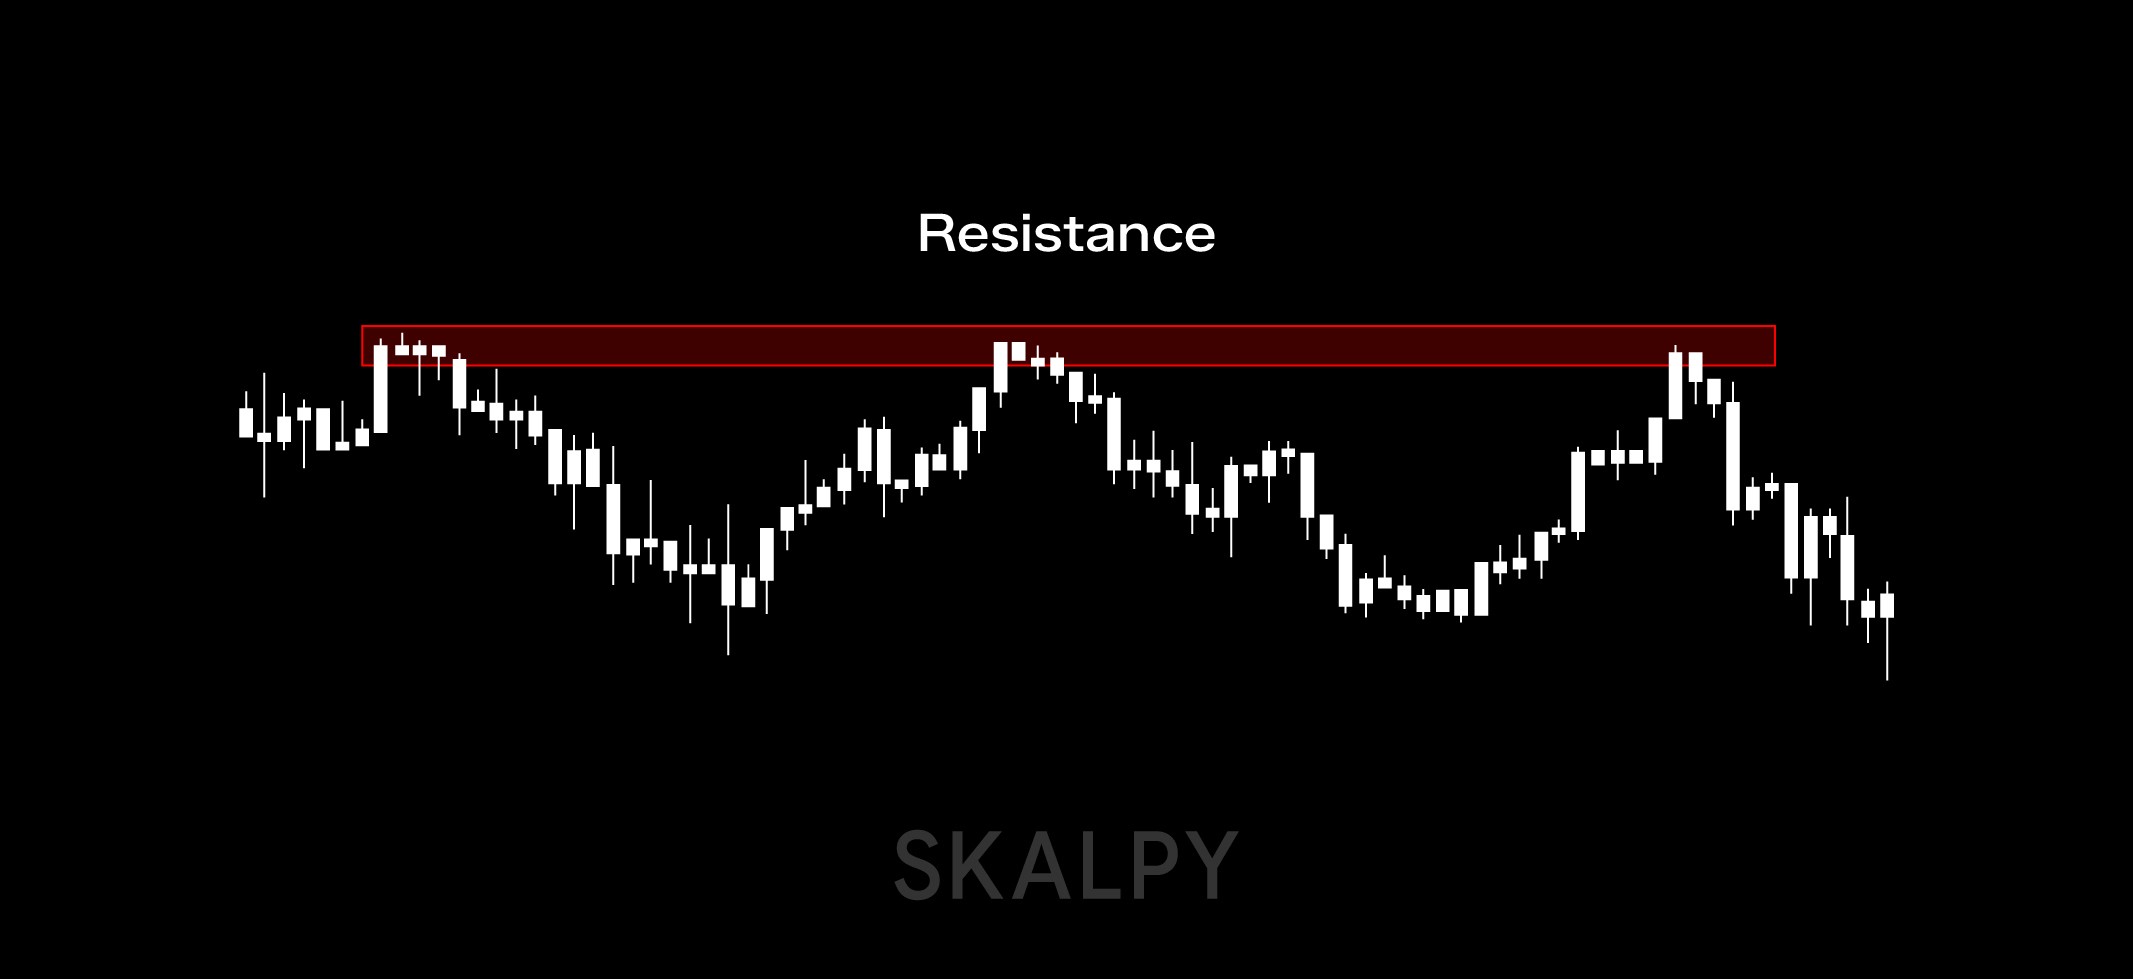
Resistance flips the script. It's the ceiling where rising prices start to stall. Maybe a stock climbs from $30 to $40, then to $45. At $50, sellers appear in force, perhaps they think it's overvalued, or they're simply taking profits. This selling pressure creates a lid that's hard to break through.
Why Should You Care?
Here's where it gets practical. Once you've spotted these levels on a chart, they become your roadmap for making decisions. When a price approaches support or resistance, you can anticipate what might happen next.
Will the price bounce off the level like it has before? Or will it finally break through and keep going? Traders position themselves based on these expectations. If you think support will hold, you might buy near that level. If you expect resistance to stop an advance, you might sell or wait for a breakthrough before jumping in.
The beauty of this approach is its built-in risk management. If the price moves against you, breaking through a level you thought would hold, you know immediately that your trade idea didn't work out. You can exit with a small loss rather than hoping things turn around. For traders who need to react quickly to these key levels, platforms like Skaply, a cross-platform trading terminal built for fast execution, provide the tools to monitor and execute trades efficiently across multiple markets.
One important note: the longer the timeframe you're looking at, the more meaningful these levels become. A support level on a monthly chart carries more weight than one on a five-minute chart.
Trendlines: Following the Flow
Markets don't just bounce between flat levels - they trend. That's where trendlines come in handy. Instead of horizontal lines, you're drawing diagonal ones that follow the market's direction.
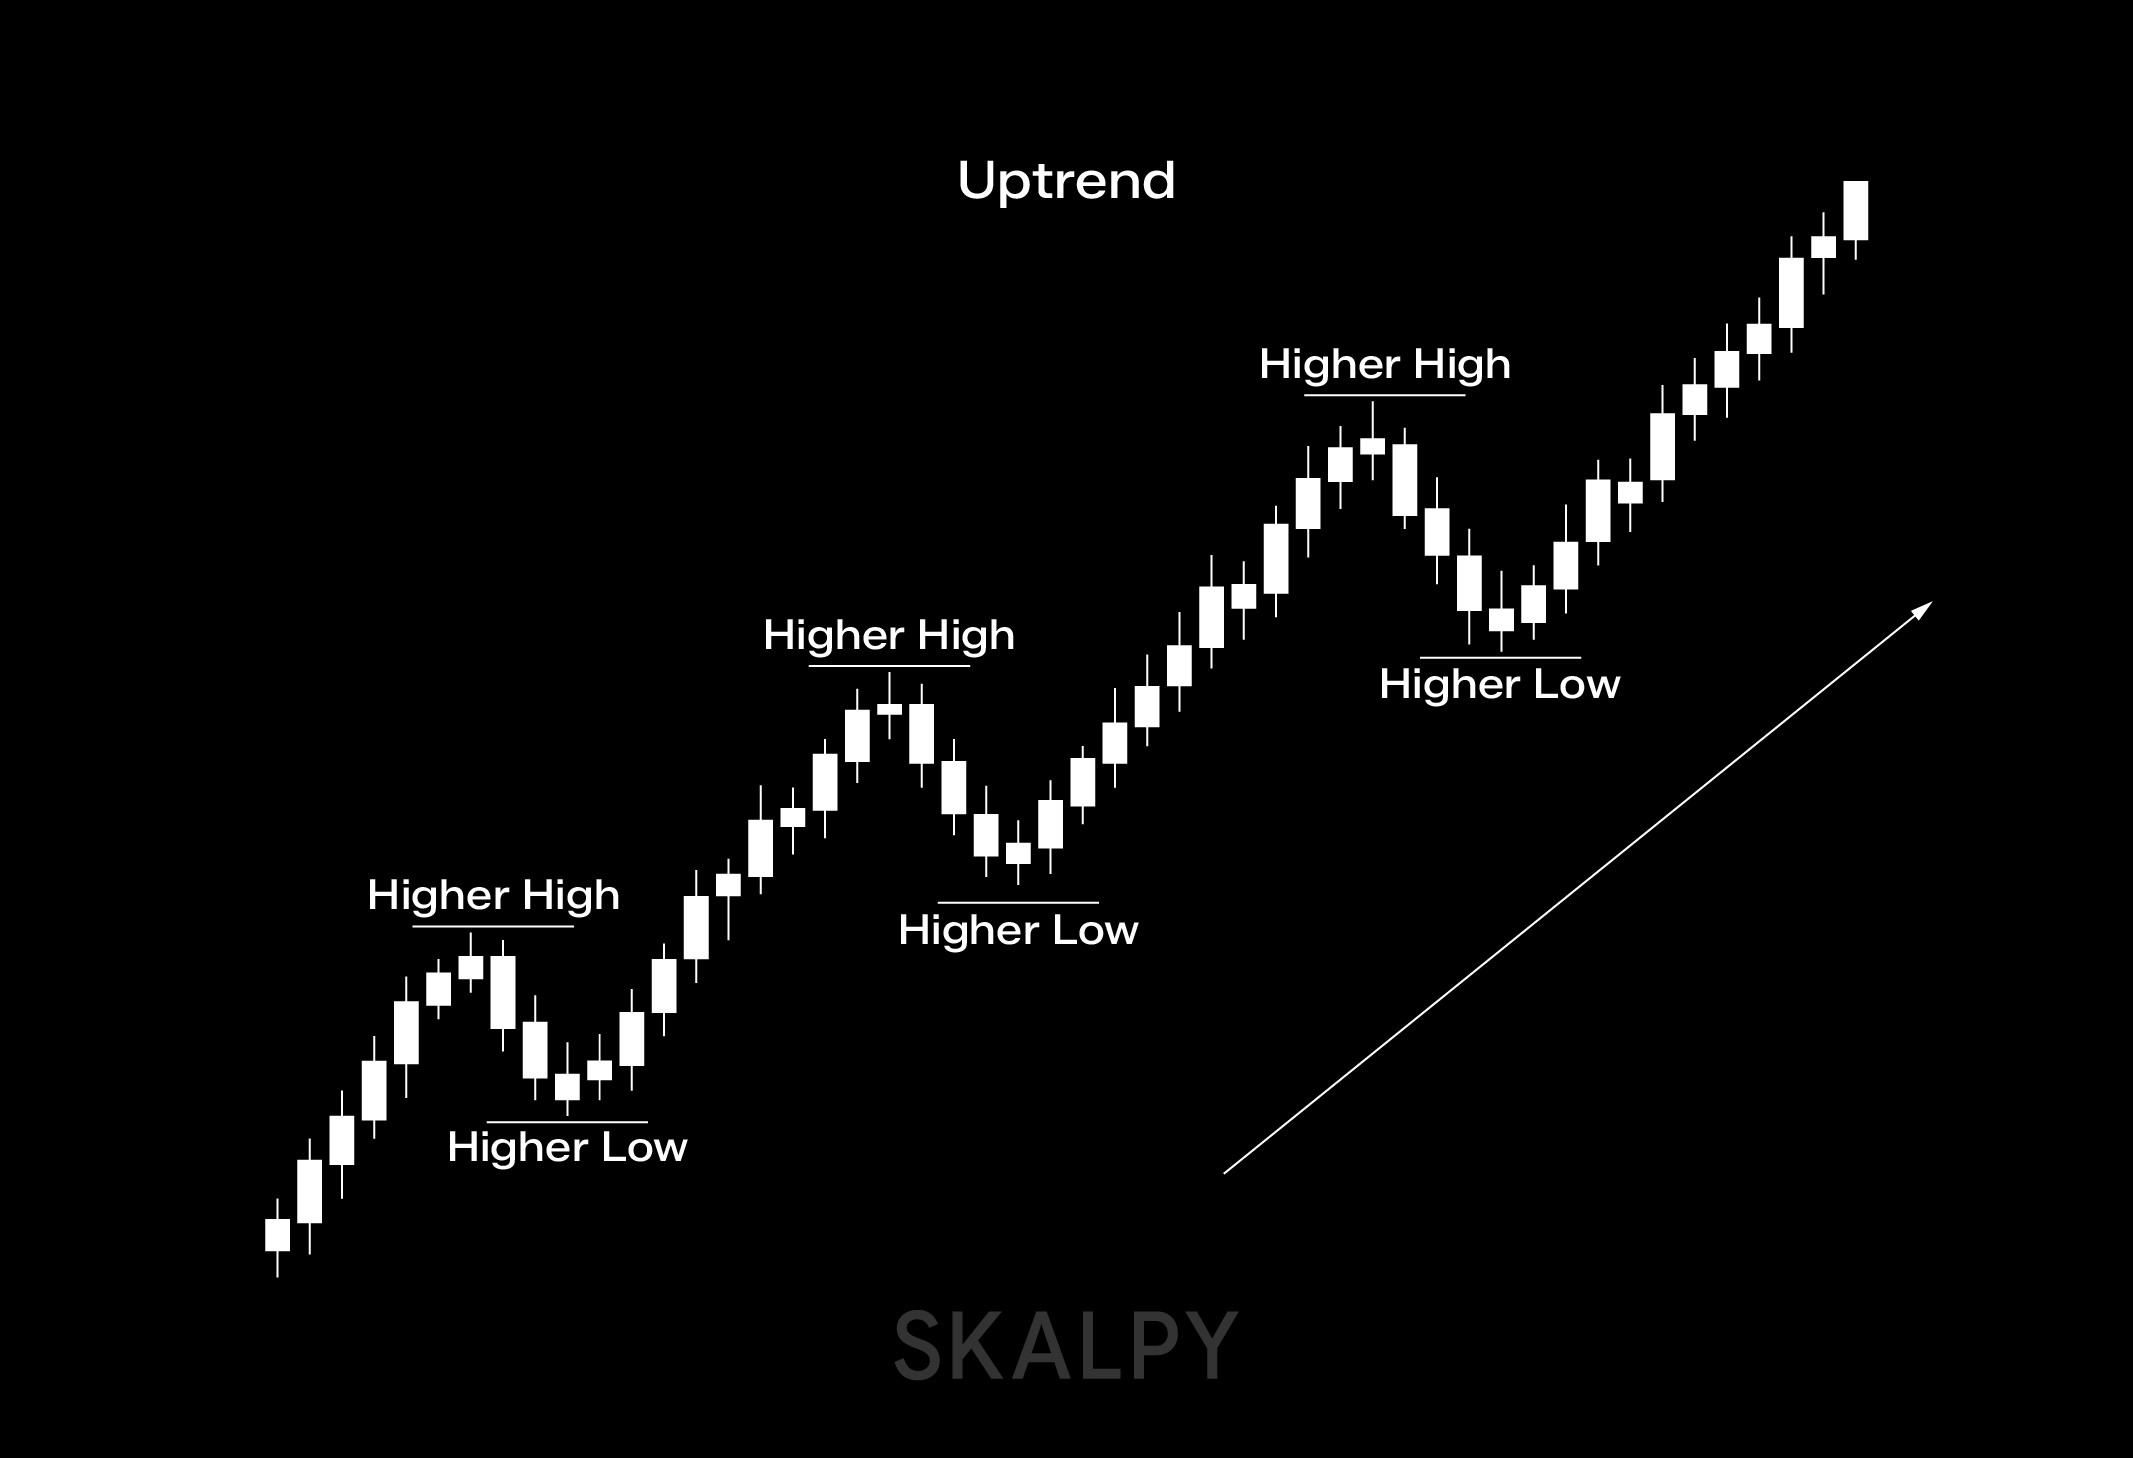
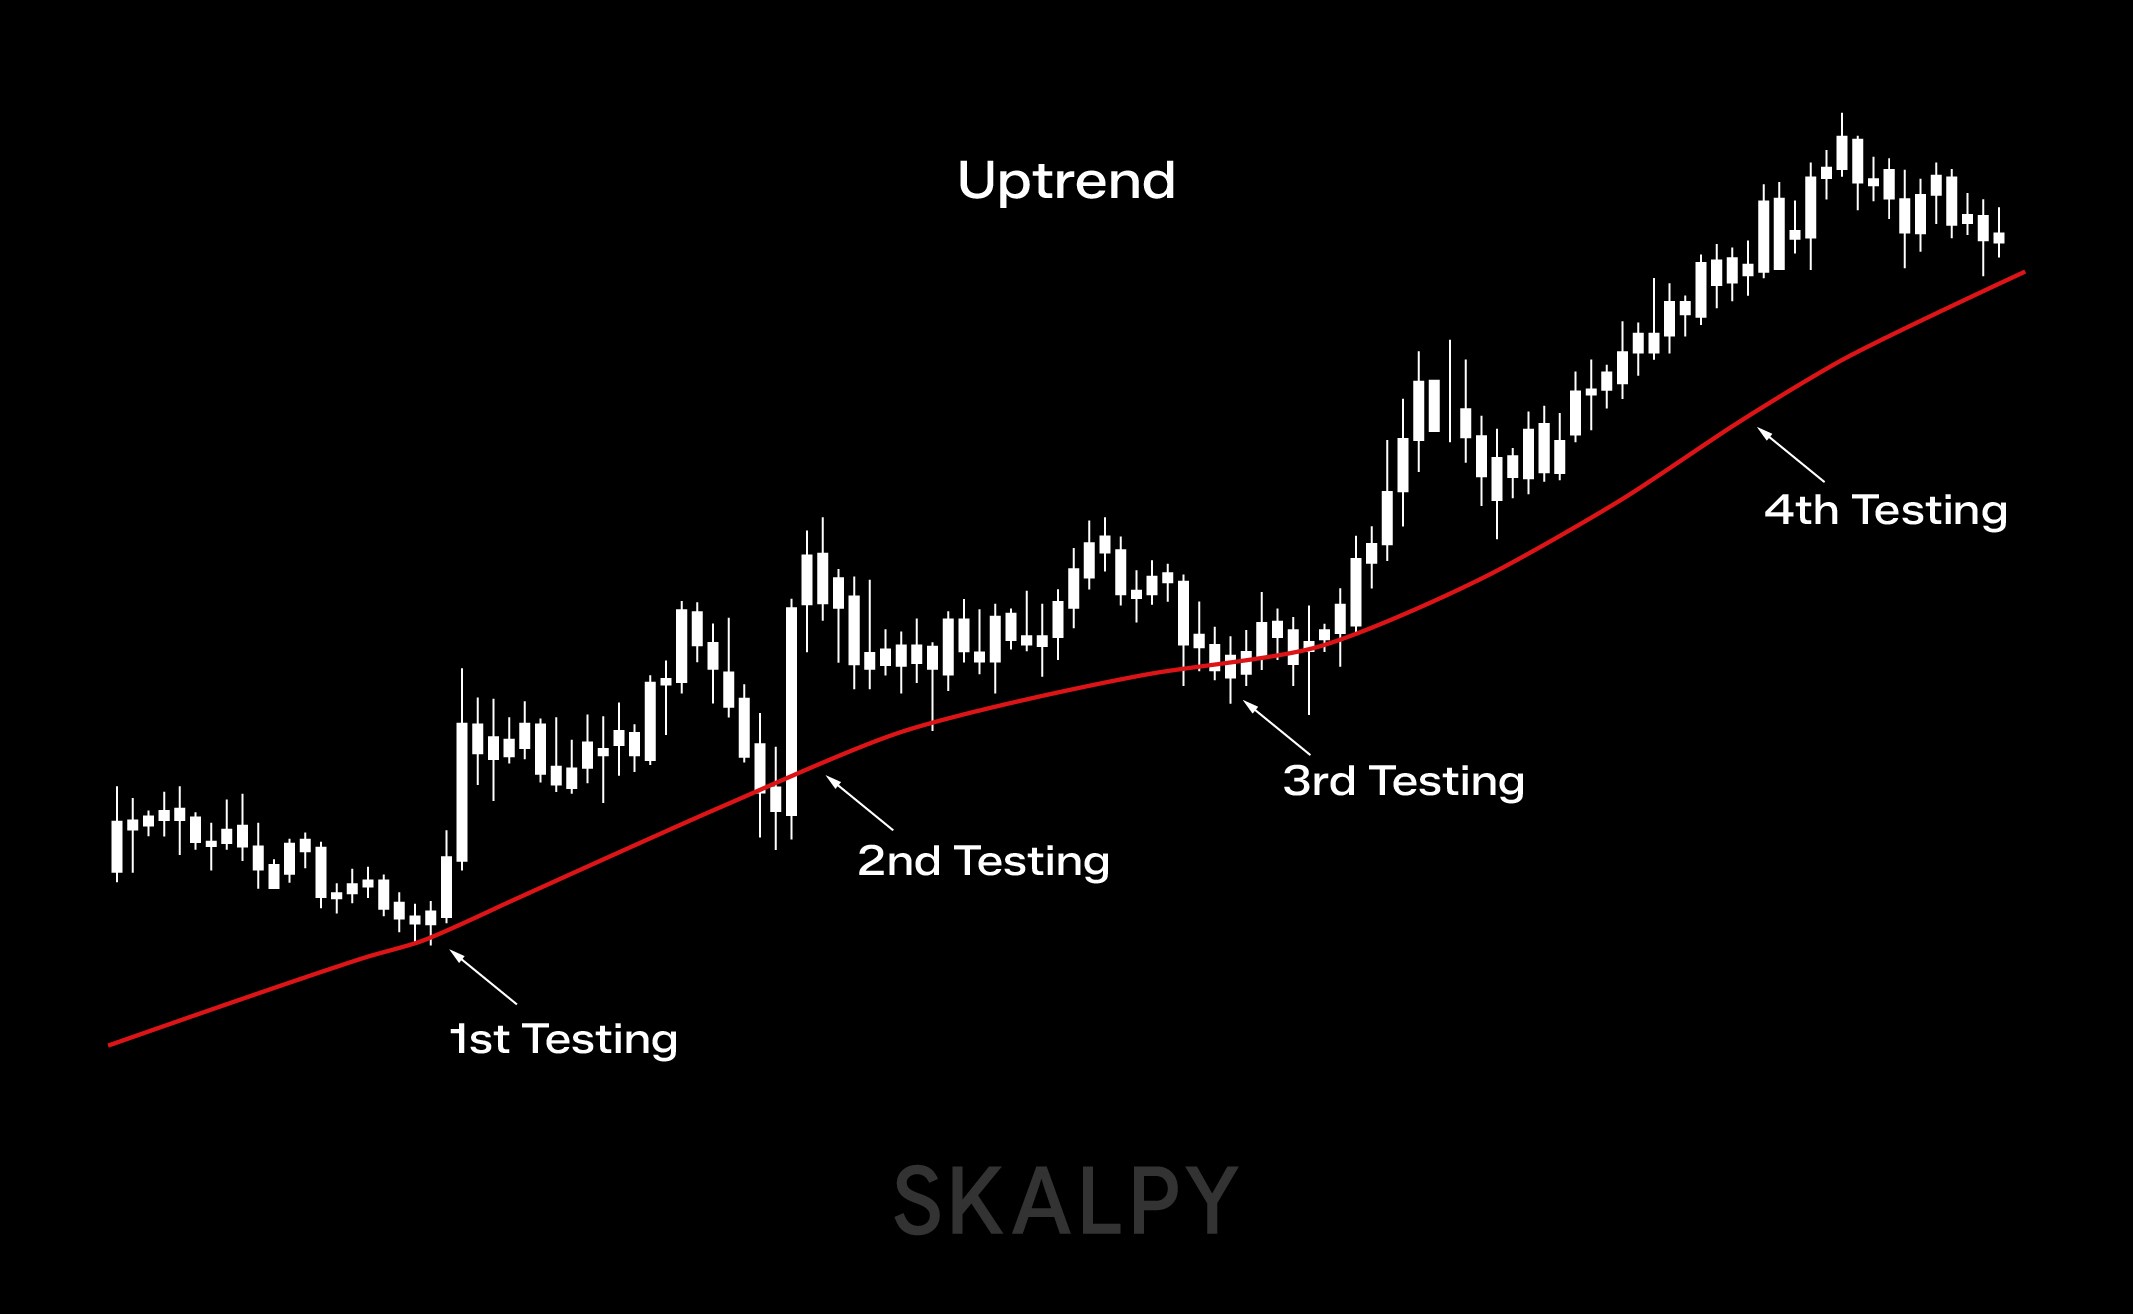
During an uptrend, connect the higher lows with a line. This trendline shows where buyers consistently defend the trend. Each time the price dips back to this line, it's a potential buying opportunity, assuming the trend remains intact.
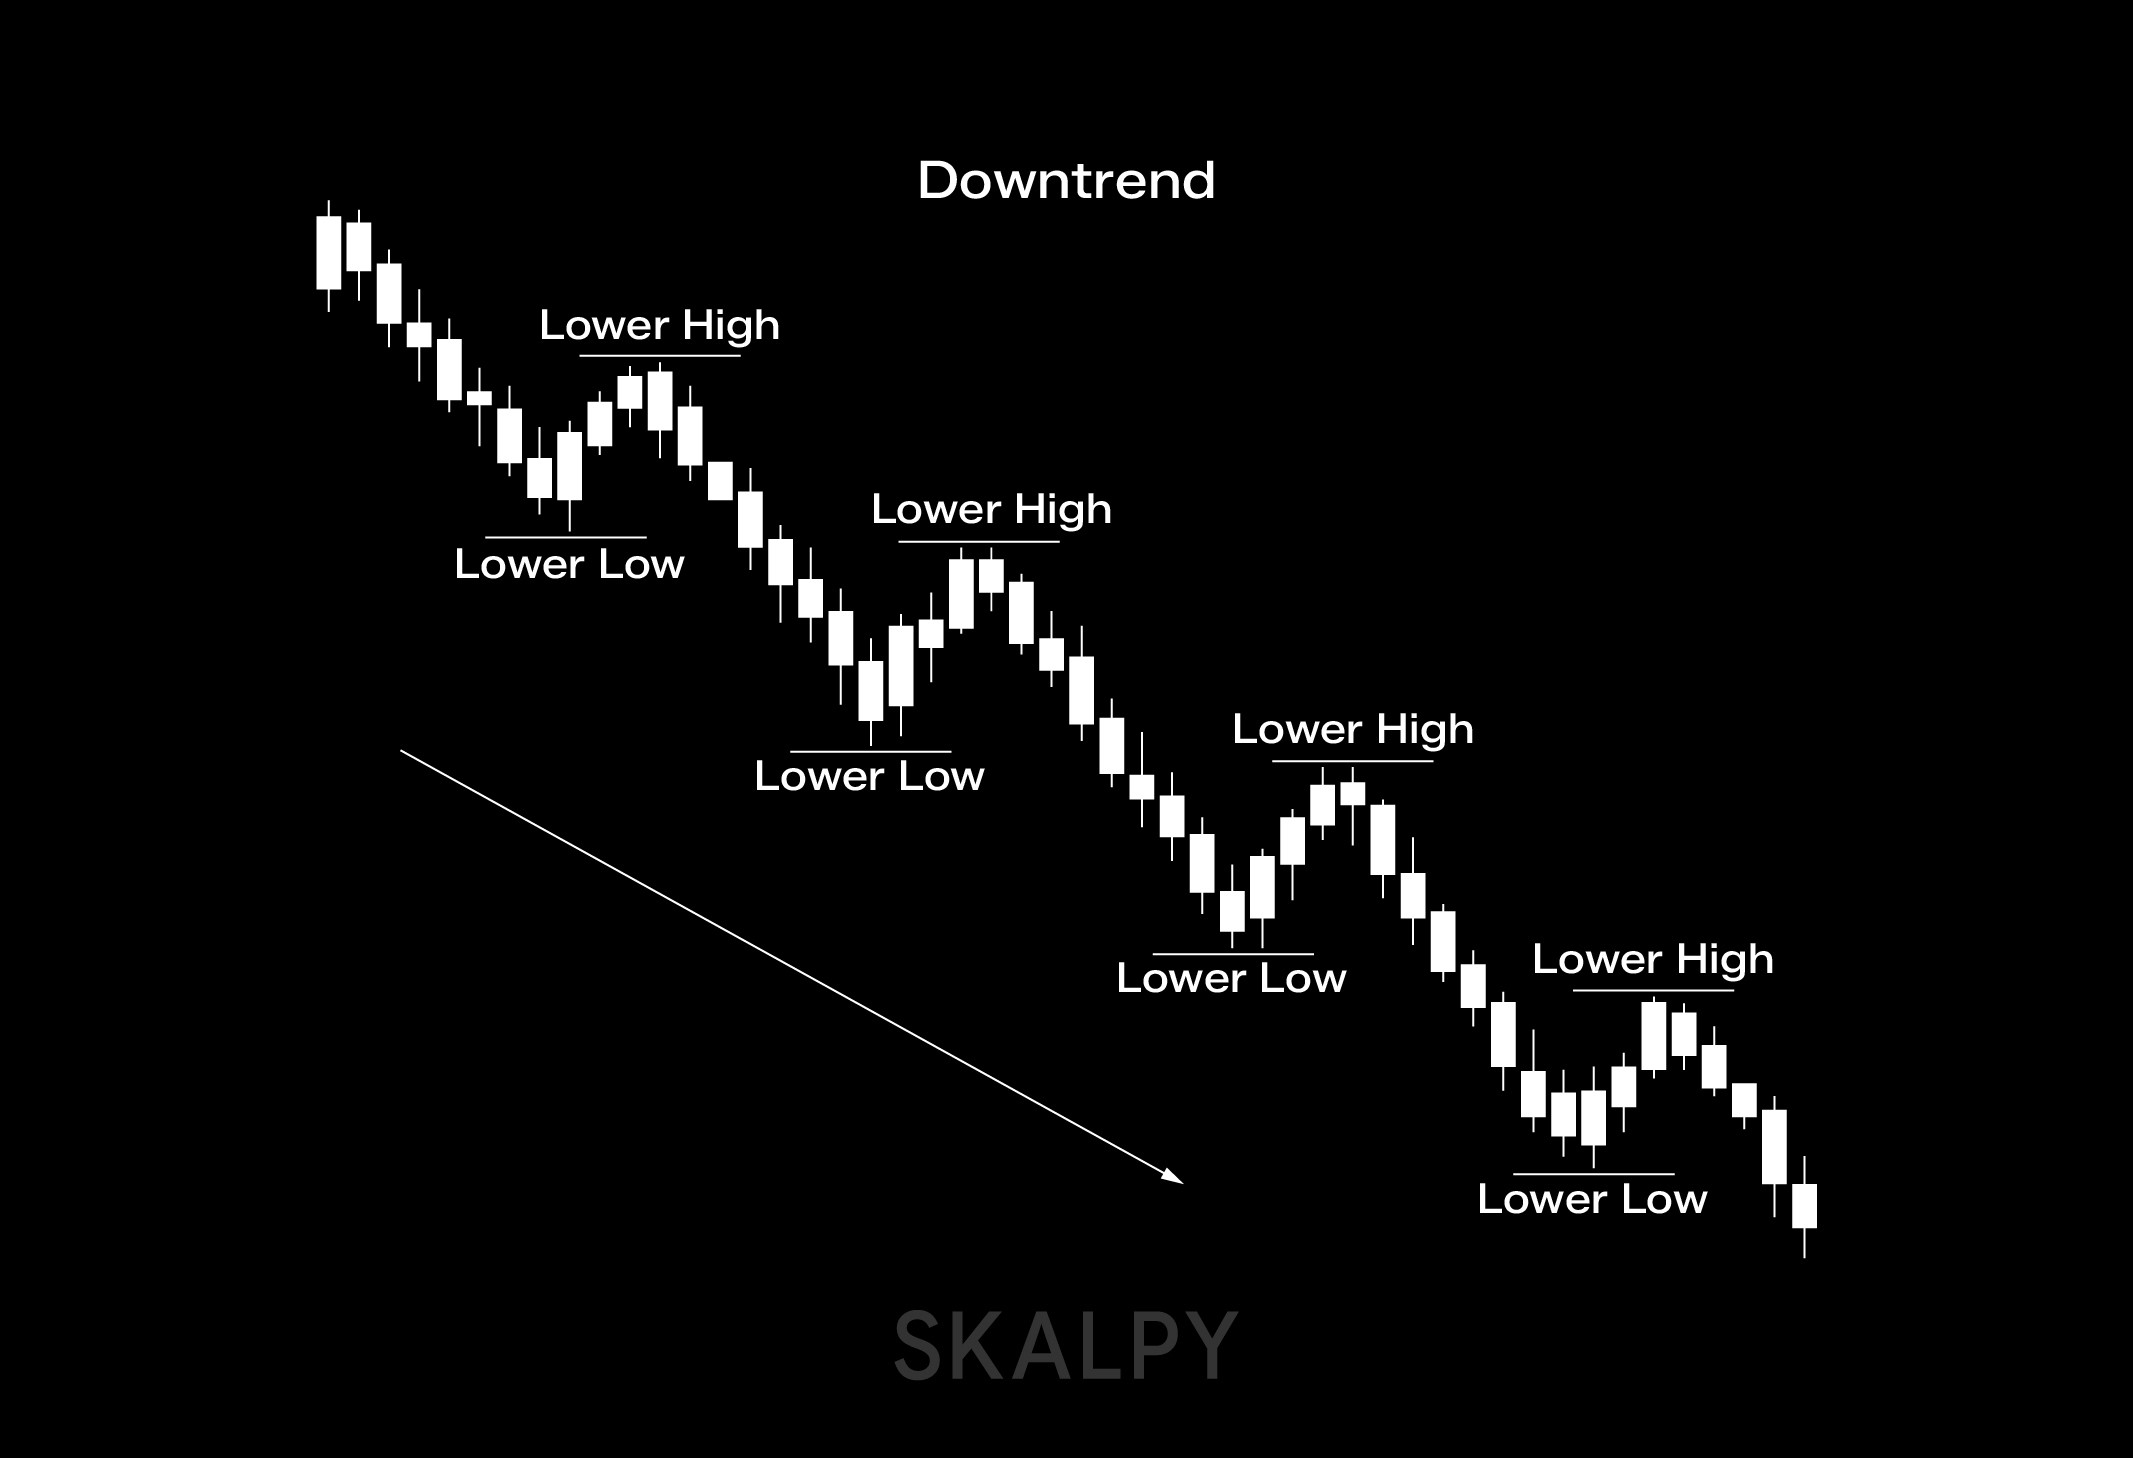
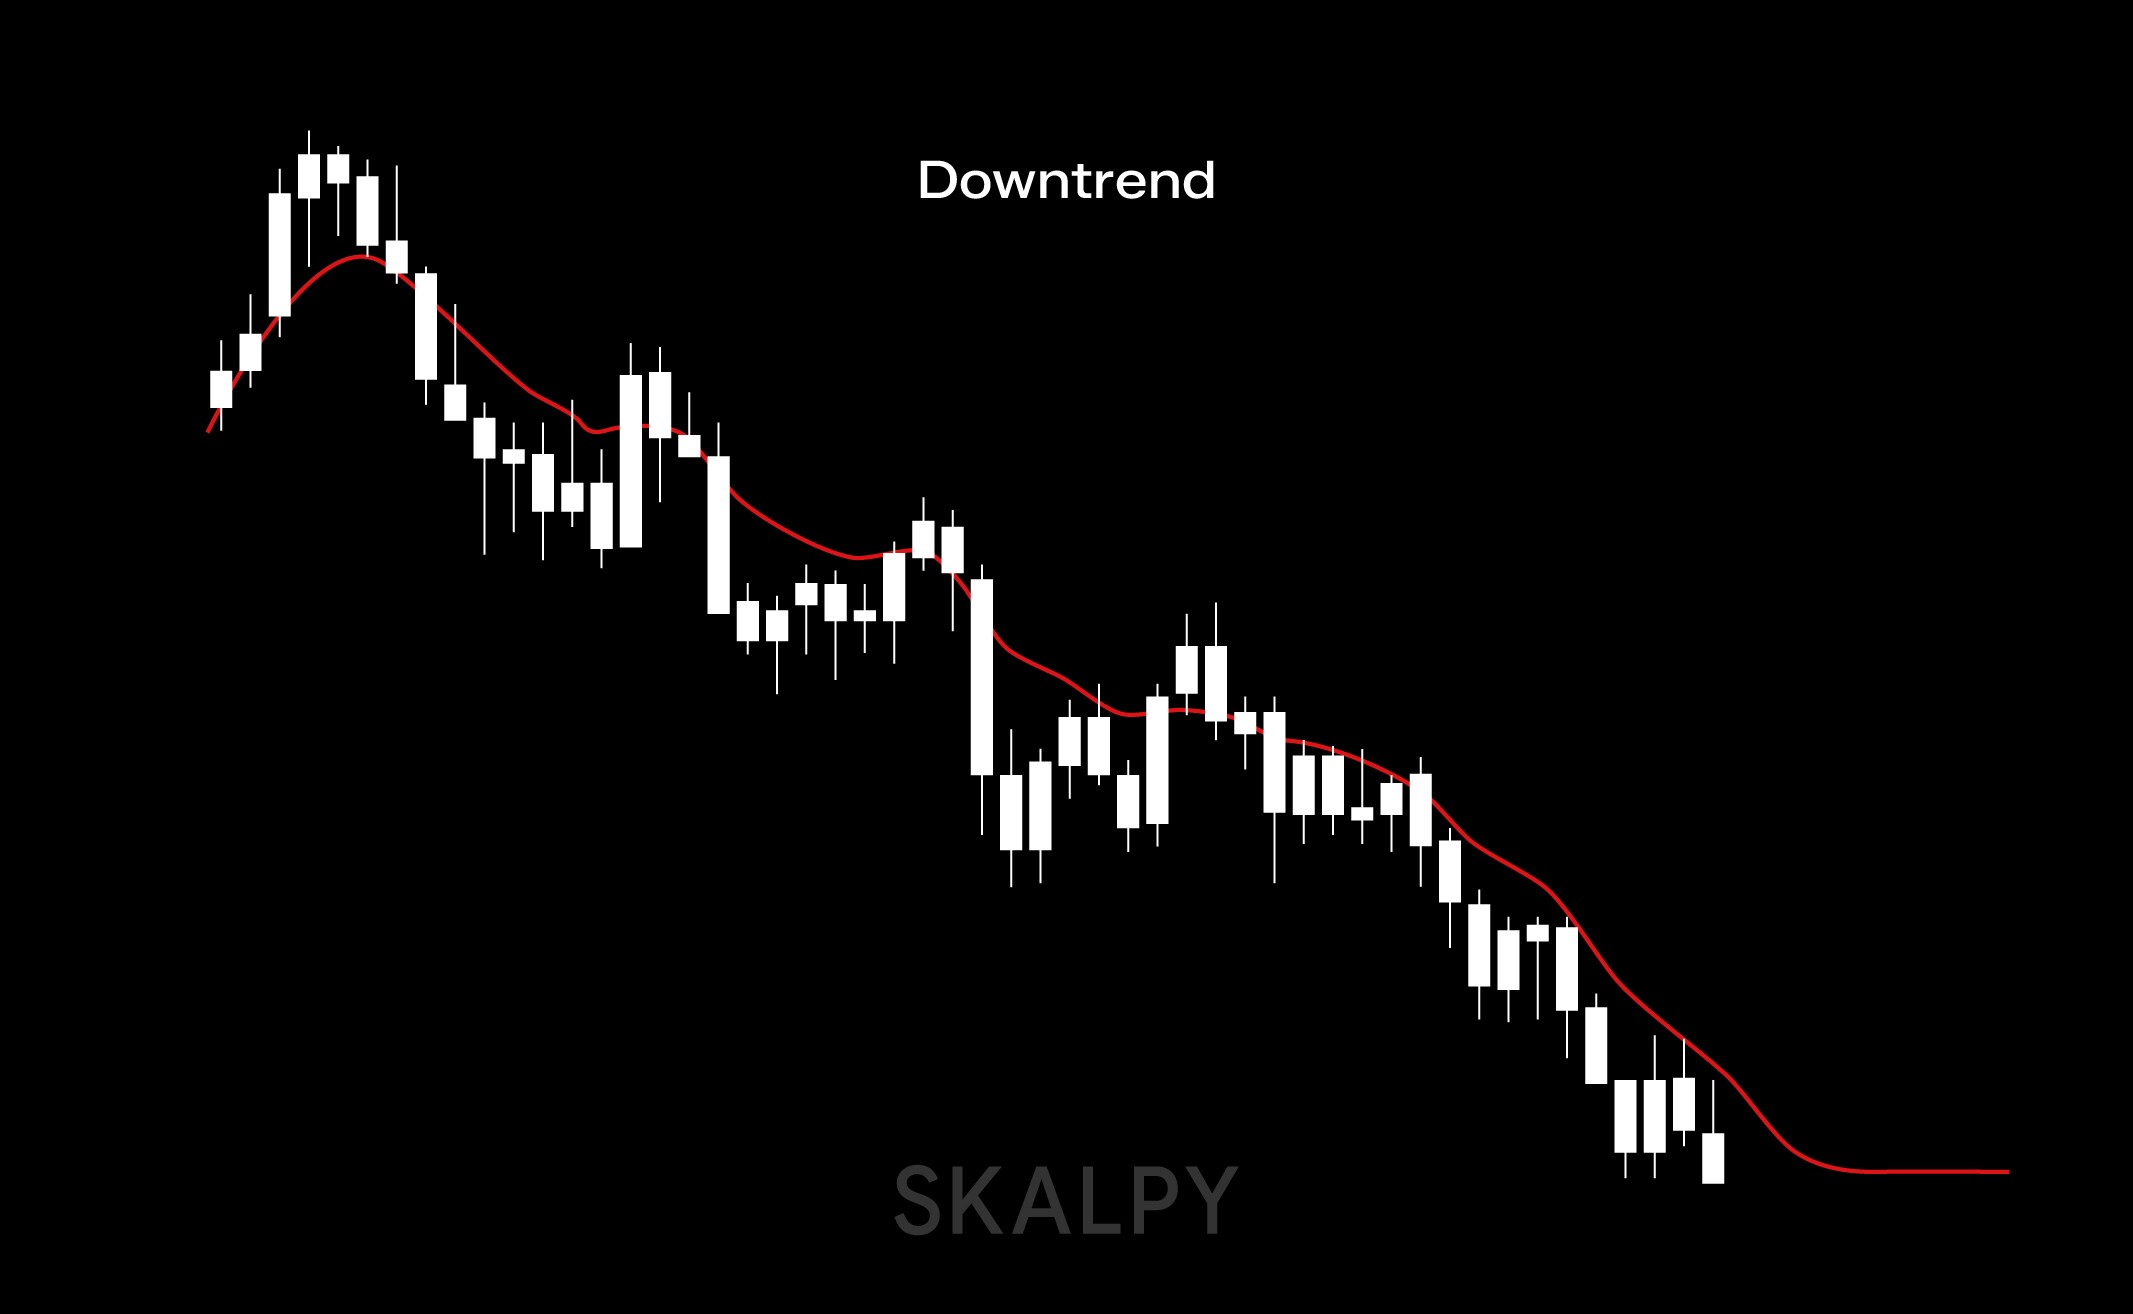
In a downtrend, do the opposite: connect the lower highs. This line represents where sellers keep showing up to push prices down.
Here's a rule of thumb: you need at least three points of contact to confirm a trendline. The more times a price touches that line without breaking it, the stronger the level becomes. Some trendlines can remain valid for months or even years.
The Power of Round Numbers
Human brains love round numbers. We naturally gravitate toward prices like $50, $100, or $1,000 when making decisions. This psychological quirk creates real market effects.
When a stock approaches $100, for example, you'll often see it struggle to break through. Why? Because countless traders have placed orders at that exact level, some buying, some selling, many just watching. This concentration of activity turns round numbers into natural support and resistance zones.
Large institutions contribute to this pattern too. When a major bank issues a price target of $75 for a stock, many clients will place sell orders near that level. All those orders create genuine resistance.
Moving Averages: Dynamic Levels
If drawing trendlines isn't your thing, moving averages offer an alternative. These lines automatically adjust to follow price trends, creating support and resistance that moves with the market.
During uptrends, prices often pull back to a moving average before resuming higher. During downtrends, the moving average acts as a ceiling. Popular choices include 50-day and 200-day moving averages, though you can experiment to find what works for your style.
The advantage? Moving averages do the work for you, constantly recalculating based on recent prices. No manual line drawing required.
When Markets Go Sideways
Sometimes prices get stuck in a range, bouncing between clear support and resistance without choosing a direction. These sideways markets frustrate trend traders but create opportunities for range traders.
The tempting strategy is buying at support and selling at resistance repeatedly. However, this approach is risky. You never know when the range will finally break. Most experienced traders prefer waiting for a breakout, a decisive move above resistance or below support, before committing their capital.
The Role Reversal Phenomenon
Here's a fascinating pattern: broken support often becomes new resistance, and vice versa. It's one of the more reliable patterns in technical analysis.
Let's say a stock has support at $40. The price eventually breaks below this level and falls to $30. Later, when the stock attempts to recover, it often struggles right around that old $40 level, which now acts as resistance.
Why? Traders remember these levels. Those who held on during the decline see the price return to their original entry point and finally sell to break even. This selling pressure transforms former support into resistance.
What Makes a Level Strong?
Not all support and resistance levels are created equal. Several factors determine their reliability:
Test Count: The more times a level holds, the more traders notice it. A level tested five times carries more weight than one tested twice.
Approach Speed: Rapid moves create stronger levels. When a stock shoots up quickly and hits a ceiling, that resistance level tends to be more significant than one formed during a slow grind higher. The drama creates memory.
Trading Volume: Heavy volume at a particular price means more traders have positions there, making that level more likely to influence future behavior.
Chart Timeframe: Weekly and monthly chart levels matter more than hourly or minute-by-minute levels. Longer timeframes reflect more substantial shifts in supply and demand.
Putting It Into Practice
To identify support and resistance, scan your charts for places where prices previously paused or reversed. These historical levels often matter in the future because traders remember them.
Start simple. Look for obvious horizontal levels where prices bounced multiple times. Then consider adding trendlines if the market is clearly trending. Finally, you might overlay a moving average or two.
Many traders also use additional tools like Fibonacci retracements to find potential levels. These tools all serve the same purpose: highlighting where prices might pause or pivot.
The Reality Check
Let's be honest, this isn't magic. Support and resistance levels aren't guaranteed to hold. Prices sometimes dip below support before recovering (fake-outs), or they might reverse before reaching known resistance.
You'll need flexibility in your interpretation. Sometimes a level is more like a zone than an exact price. Other times, what looked like solid support crumbles under selling pressure.
Critics point out that these levels are based entirely on past price action. They're right. Technical analysis assumes history tends to repeat because traders are human and often react similarly to similar situations. It's not a crystal ball, it's pattern recognition based on collective behavior.
Why It Actually Works
The reason support and resistance levels have any predictive value comes down to human nature. When many traders reference the same price levels, those levels become self-fulfilling prophecies. If enough people believe $100 is important resistance, their collective actions at that price make it important.
It's market psychology in action. Anchoring bias causes traders to fixate on previous highs and lows. Loss aversion makes people desperate to exit at breakeven rather than take a loss. These behavioral patterns create the price patterns we see on charts.
Wrapping Up
Support and resistance give structure to trading decisions. Instead of buying or selling based on gut feelings or hope, you're using observable price levels where supply and demand have historically shifted.
Think of these tools as guidelines rather than rules. They work often enough to be useful, but not so perfectly that trading becomes easy. The market always has the final say.
Whether prices respect these levels or blow right through them, the resulting action tells you something valuable. It's information you can use to manage your positions, adjust your strategy, or decide to stay on the sidelines.
Master these concepts, and you'll have a framework for understanding why prices move the way they do, and more importantly, where they might move next. Traders looking to apply these strategies across crypto markets can explore Skaply, a crypto trading platform designed for technical analysis and quick execution.
Scalping
Dynamic Position Sizing: Scaling In and Out of Fast-Moving Trades
Learn how professional crypto scalpers use dynamic position sizing, scaling in, and scaling out to maximize profits and minimize risk during fast market movements.

Trading
Tilt and Revenge Trading: How to Hit the Kill Switch Before You Liquidate
Learn how to recognize tilt in crypto scalping and stop the urge to revenge trade. Discover practical risk management methods to protect your trading capital from liquidation.

Trading
Order Book Manipulation: How to Spot Spoofing, Layering, and Iceberg Orders
Learn how to identify crypto order book manipulation tactics like spoofing, layering, and iceberg orders to protect your trades and spot real market liquidity.

