Technical Analysis
RSI Indicator: How to Read Market Momentum and Find Entry Points
Jan 6, 2026
written by:


Why Traders Need RSI
Successful trading is built on the ability to recognize patterns and understand when the market is ready to reverse. Instead of relying on luck, professionals use proven tools to assess the strength of current price movements. One such tool, the Relative Strength Index (RSI), has become an indispensable assistant for millions of traders worldwide.
RSI works like a barometer of market sentiment. It shows how aggressively buyers or sellers control the situation at any given moment. This indicator is particularly valuable because it translates complex price fluctuations into a simple numerical scale that even beginners can understand.
Creation Story: From Failures to Breakthrough
We owe the emergence of RSI to J. Welles Wilder, who introduced this indicator to the world in 1978 through his book New Concepts in Technical Trading Systems. Interestingly, Wilder didn't come to trading from the financial sector. His original specialization was in mechanical engineering and real estate development.
When Wilder tried his hand at stock trading in the early 1970s, the results were disappointing. However, these failures pushed him toward systematic market study. Applying his engineering skills to chart analysis, he developed several mathematical formulas that later became classics of technical analysis. Remarkably, it took only six months to write the book, yet its influence is still felt today, nearly fifty years later.
Mathematics Behind Simplicity: Operating Principle
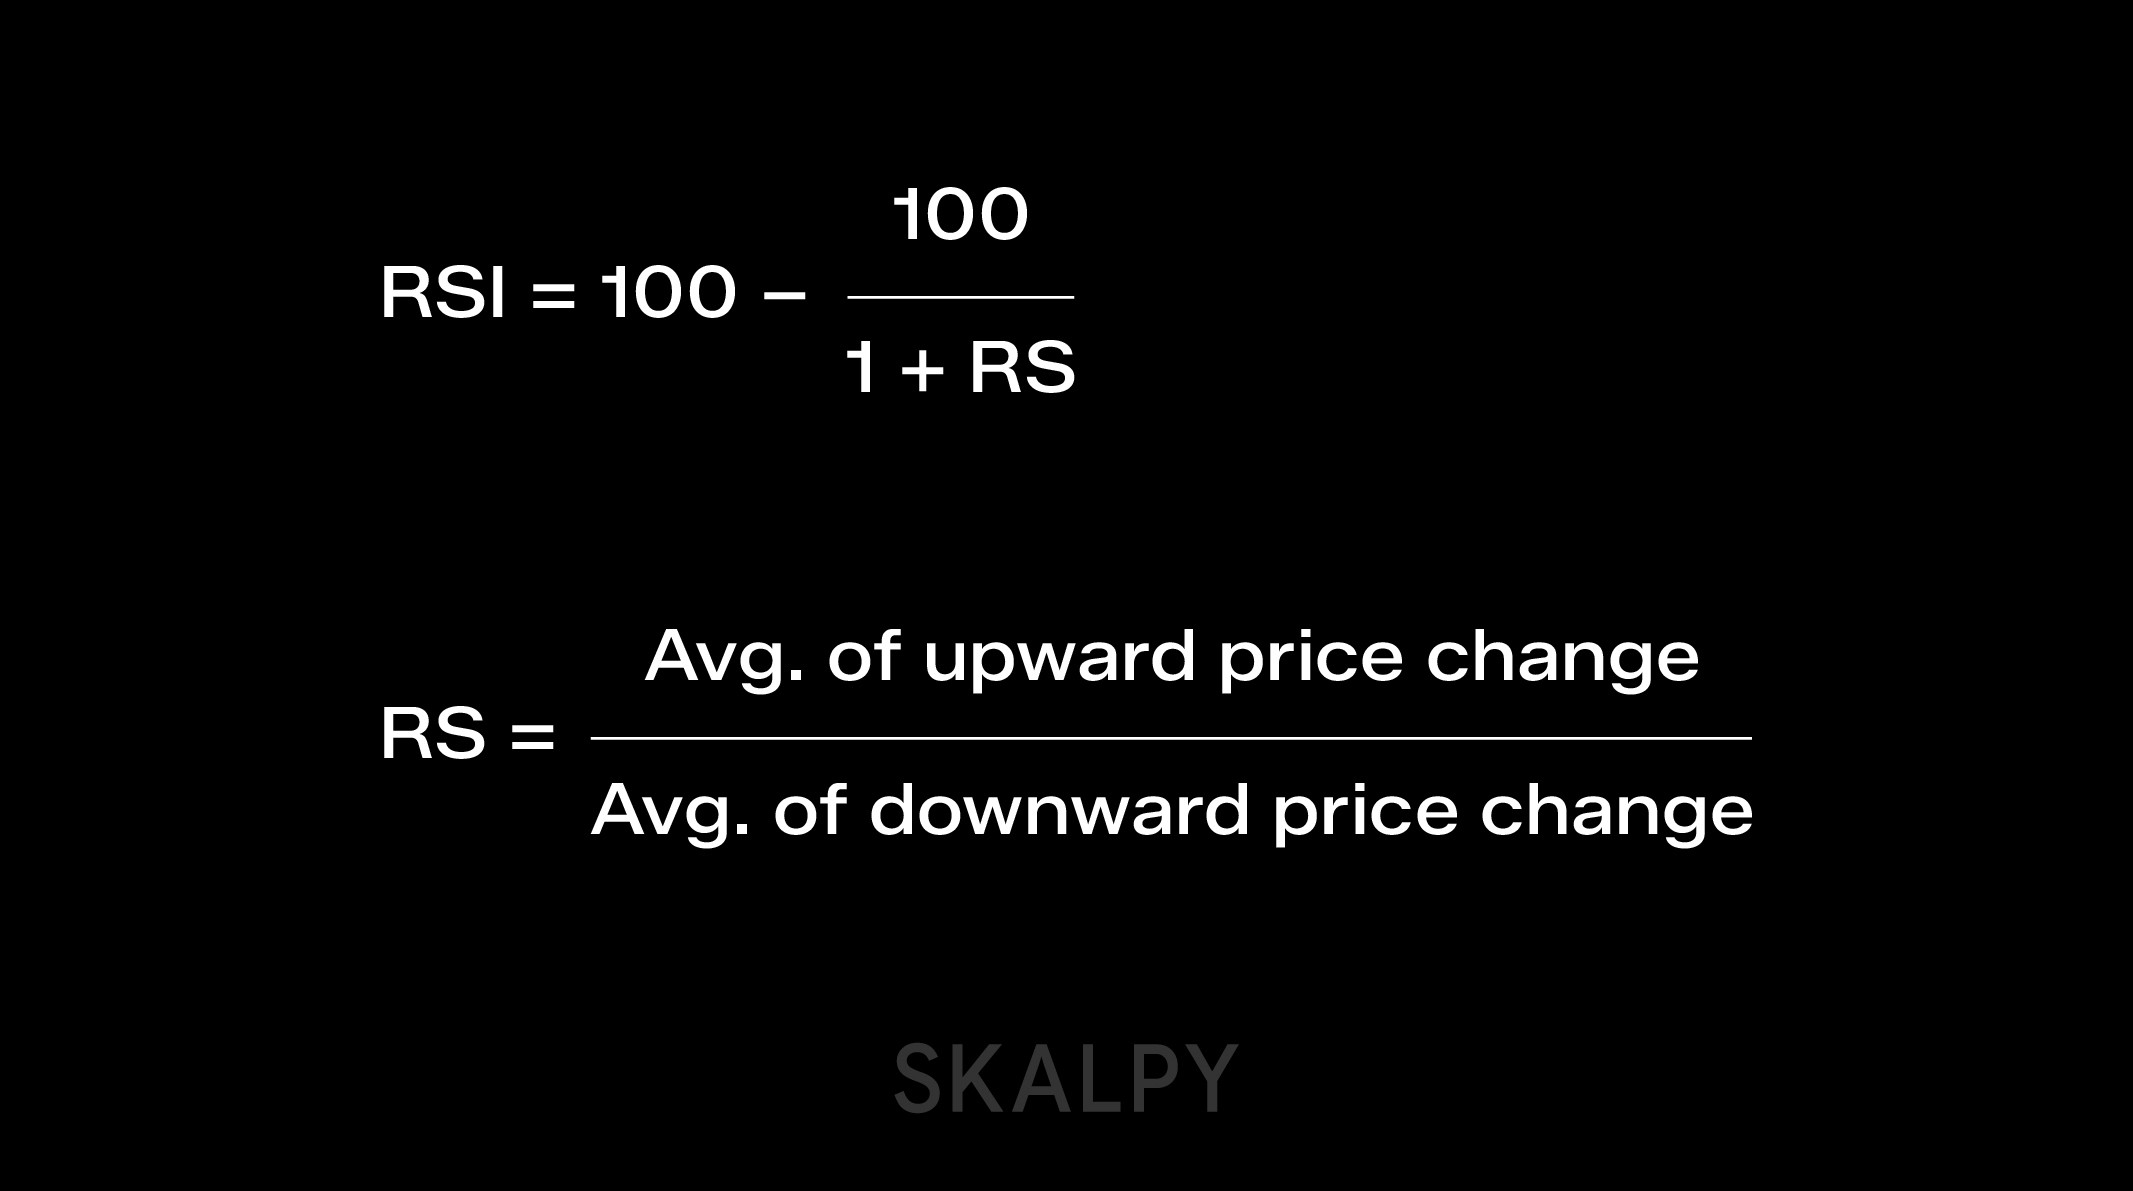
The RSI concept is based on comparing the strength of upward and downward movements. The standard setting covers 14 trading periods. These can be days, hours, or even minutes, depending on the chosen timeframe.
The formula calculates the average value of all positive price changes and divides it by the average value of all negative changes over the selected period. The resulting value is normalized to a scale from 0 to 100, where each value carries specific information about market conditions.
The key advantage of RSI lies in its ability to show the speed of changes. When price rises rapidly and RSI also shoots upward, this indicates strong buyer interest. A sharp drop in both indicators signals growing seller pressure.
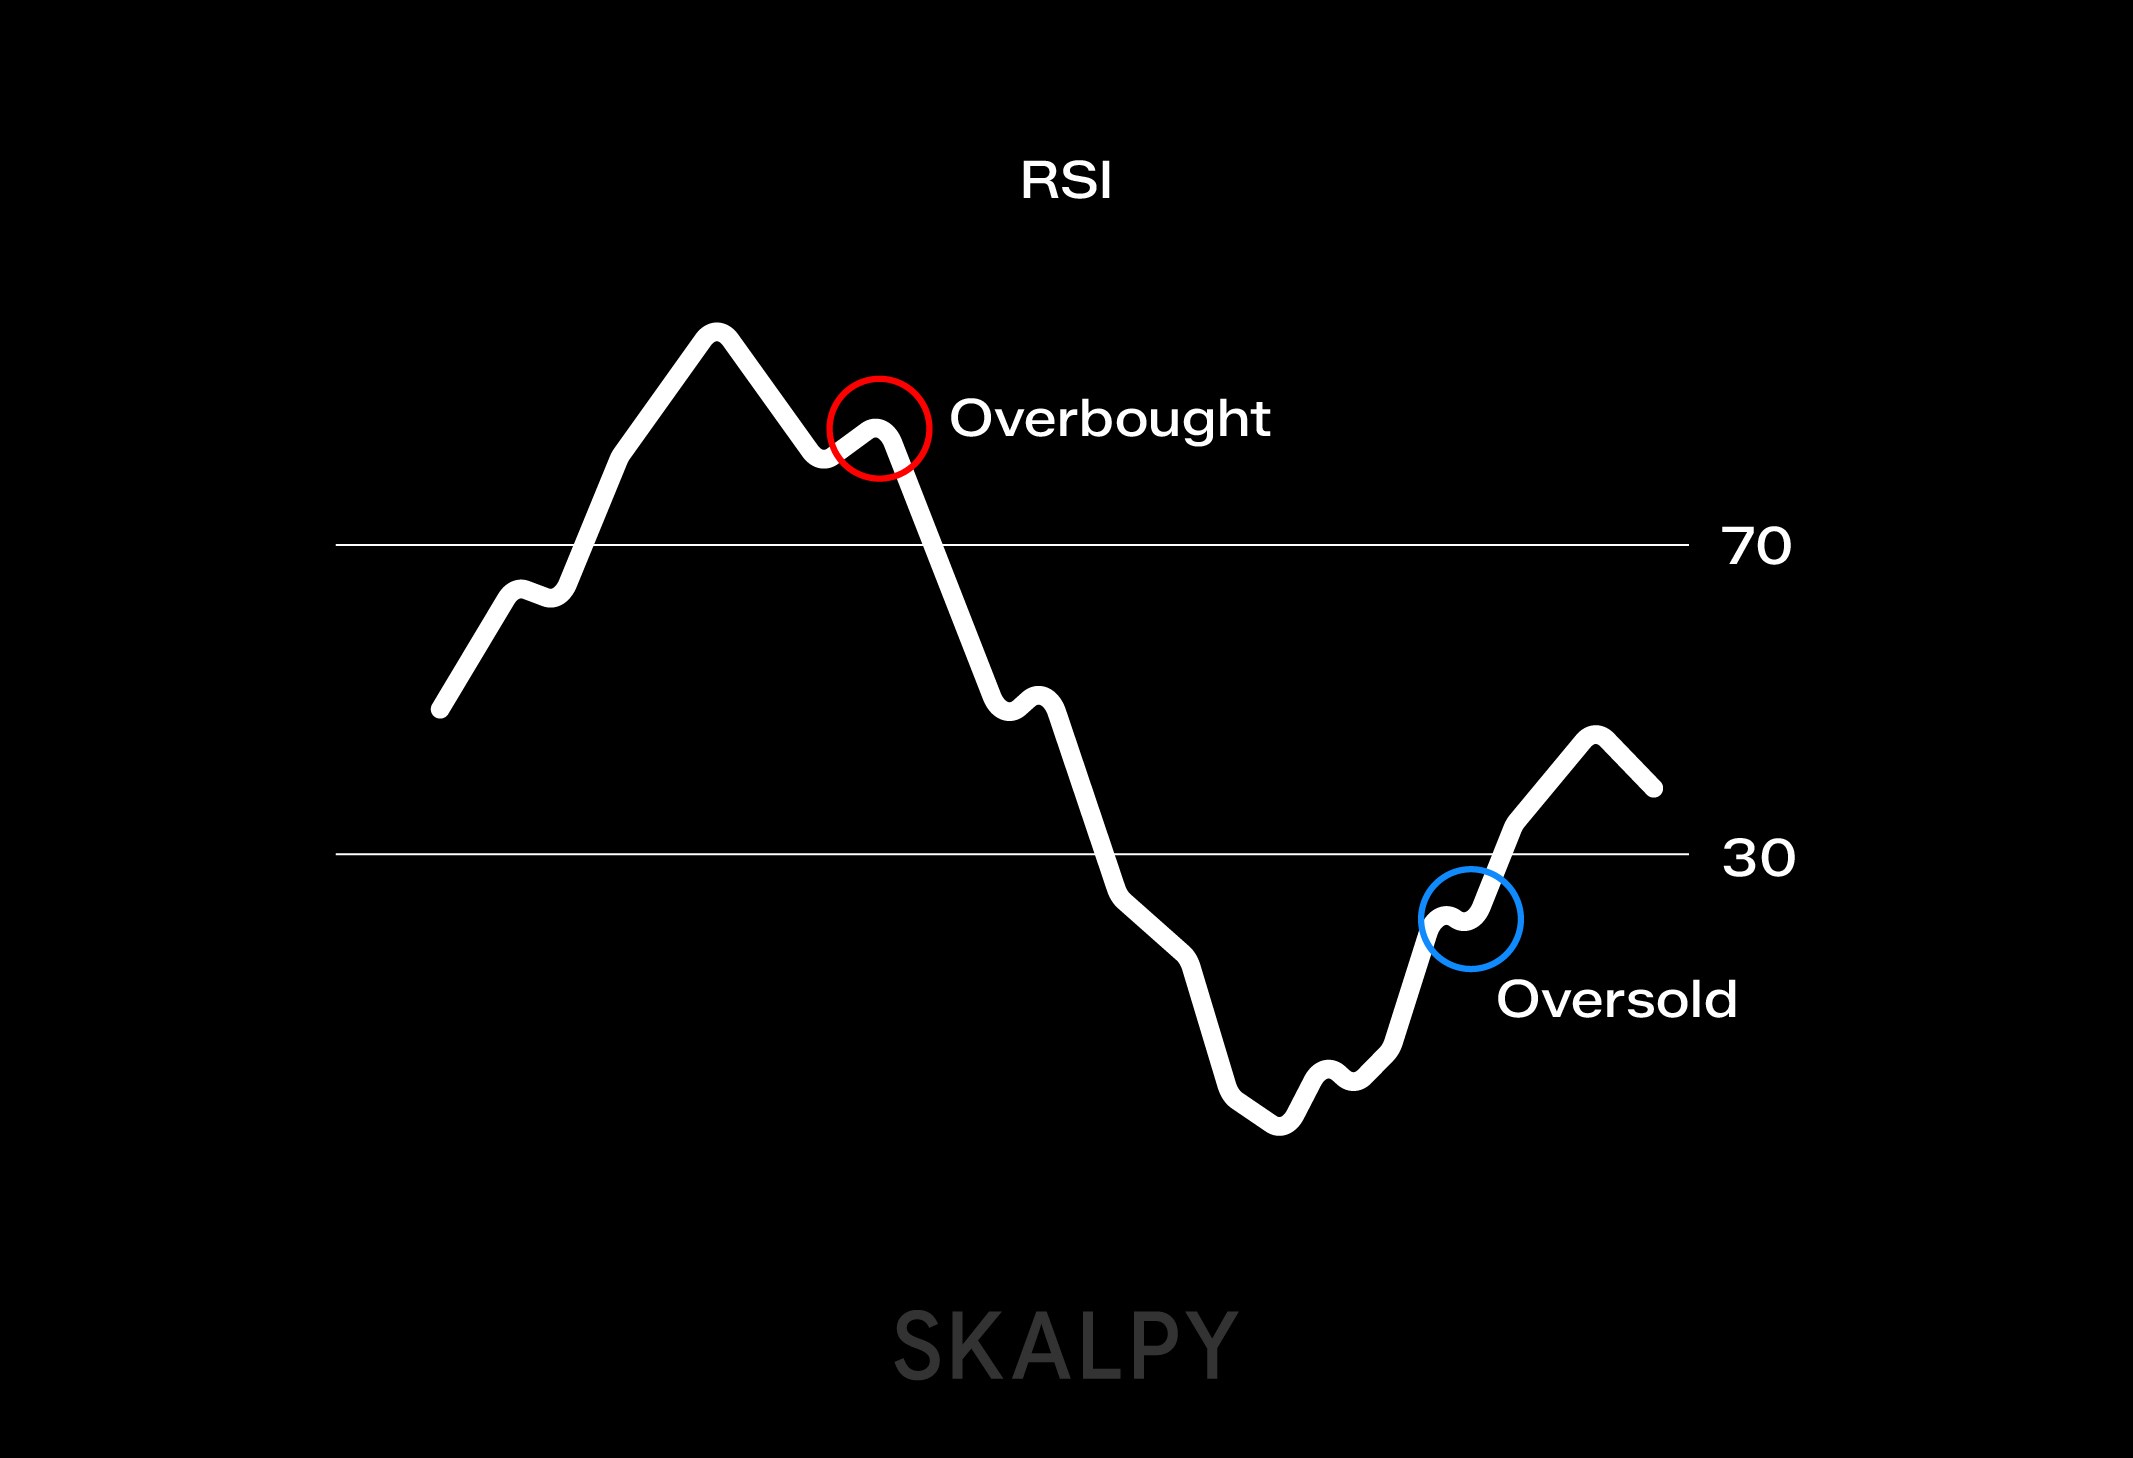
Critical Zones: When Market Is Overheated or Oversold
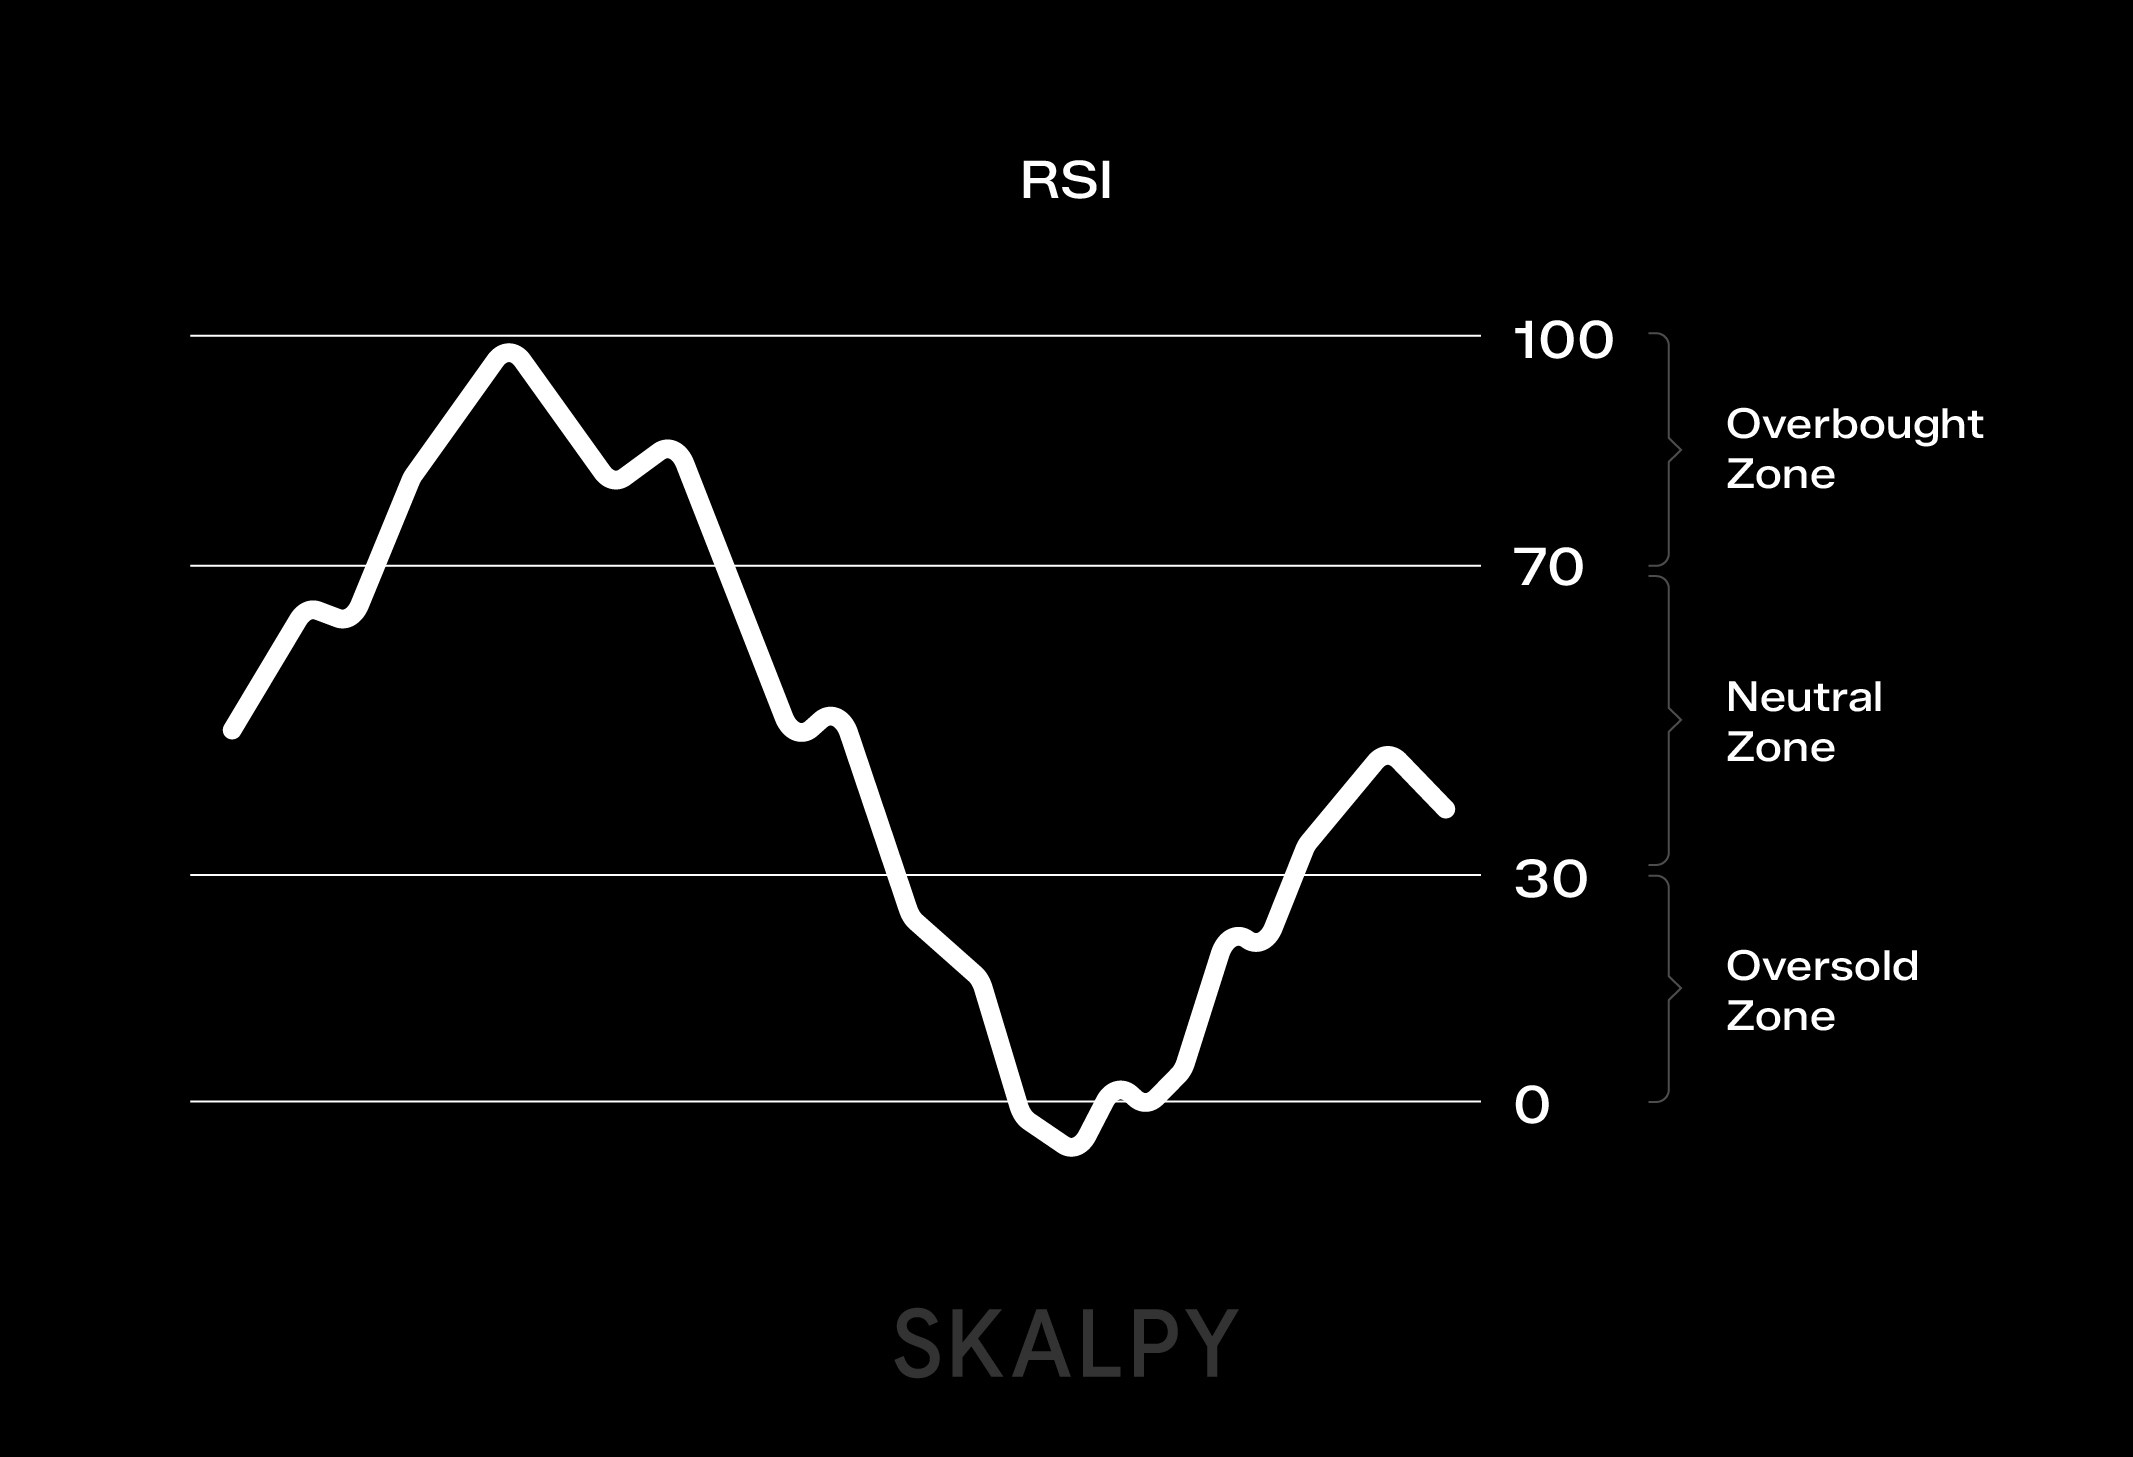
The RSI scale is divided into three functional areas, each communicating important information to the trader:
Oversold Zone (0-30): When the indicator drops into this area, the asset is likely experiencing excessive seller pressure. Historically, such moments often precede an upward price bounce.
Neutral Territory (30-70): In this range, the market is in relative equilibrium. Neither buyers nor sellers have a clear advantage.
Overbought Zone (70-100): High RSI values indicate excessive buyer enthusiasm. Often after reaching such levels, a correction or pullback follows.
Important nuance: these threshold values aren't set in stone. Active traders adapt parameters to their style. For example, scalpers might use a 7-period RSI for faster market reaction, while position traders prefer 21 periods to filter market noise. Some shift the boundaries to 20/80 altogether to catch only the most extreme situations.
Advanced Technique: Catching Reversals Through Divergences
Experienced market players extract much more information from RSI than just overbought levels. They track discrepancies between price behavior and the indicator, known as divergences.
Bullish divergence occurs at an interesting moment: price continues to update local lows and falls lower and lower, but RSI meanwhile begins to rise and forms higher bottoms. What does this mean? Despite the visible decline, the internal strength of buyers is growing. Sellers are losing control, and a reversal upward may soon occur.
Bearish divergence represents a mirror situation: the price chart confidently storms new peaks, while RSI begins to weaken and shows increasingly lower peaks. The market looks strong on the outside, but growth momentum is exhausting. This is a warning of possible correction.
Traps and Method Limitations
RSI divergences are a powerful signal, but not a panacea. The main problem manifests during strong trends. Imagine a powerful bear market: RSI can show three, four, even five bullish divergences before price actually reverses. Each time a trader blindly following the signal will lose money.
That's why professionals apply divergences selectively, primarily in markets with moderate volatility, in sideways movements, or during weak trends. In conditions of aggressive bullish or bearish movement, this tool often gives premature signals.
The golden rule of technical analysis is to never rely on one indicator. RSI shows its best side in combination with other tools, such as support and resistance levels, trading volumes, moving averages, or Japanese candlestick patterns. Only a comprehensive approach minimizes the number of false market entries. In real trading conditions, acting on technical analysis signals often matters more than the indicators themselves. For traders working across multiple crypto markets, platforms like Skaply, a fast cross-platform trading terminal, help streamline trade execution and support timely decision-making.
Practical Conclusions
RSI deservedly belongs in the basic toolkit of any serious trader. Its versatility is evident in its applicability to any market, from stocks and currencies to cryptocurrencies and commodity futures.
Mastery of this indicator comes through practice and an understanding of context. It's important to experiment with settings, test different threshold values, and, most importantly, remember its limitations. RSI doesn't predict the future. It only helps assess the current balance of forces between buyers and sellers.
Combine RSI with fundamental analysis and other technical tools, manage risks, and this simple indicator can become a reliable compass in the vast ocean of financial markets.


