Technical Analysis
Bearish Pennant Pattern: Comprehensive Trading Guide
Dec 22, 2025
written by:


What You're Actually Looking At
The bearish pennant isn't some mystical chart formation, it's just how markets behave when they're falling. After a sharp drop, price takes a breather, forms a little triangle, then often continues lower. Think of it as the market catching its breath mid-decline before potentially resuming the downward journey.
You'll spot this pattern across all markets: stocks, futures, crypto, forex. It doesn't discriminate. And it shows up on different timeframes too, from 5-minute charts to daily charts. The principles stay the same.
Breaking Down What Makes This Pattern
The Three Parts That Matter
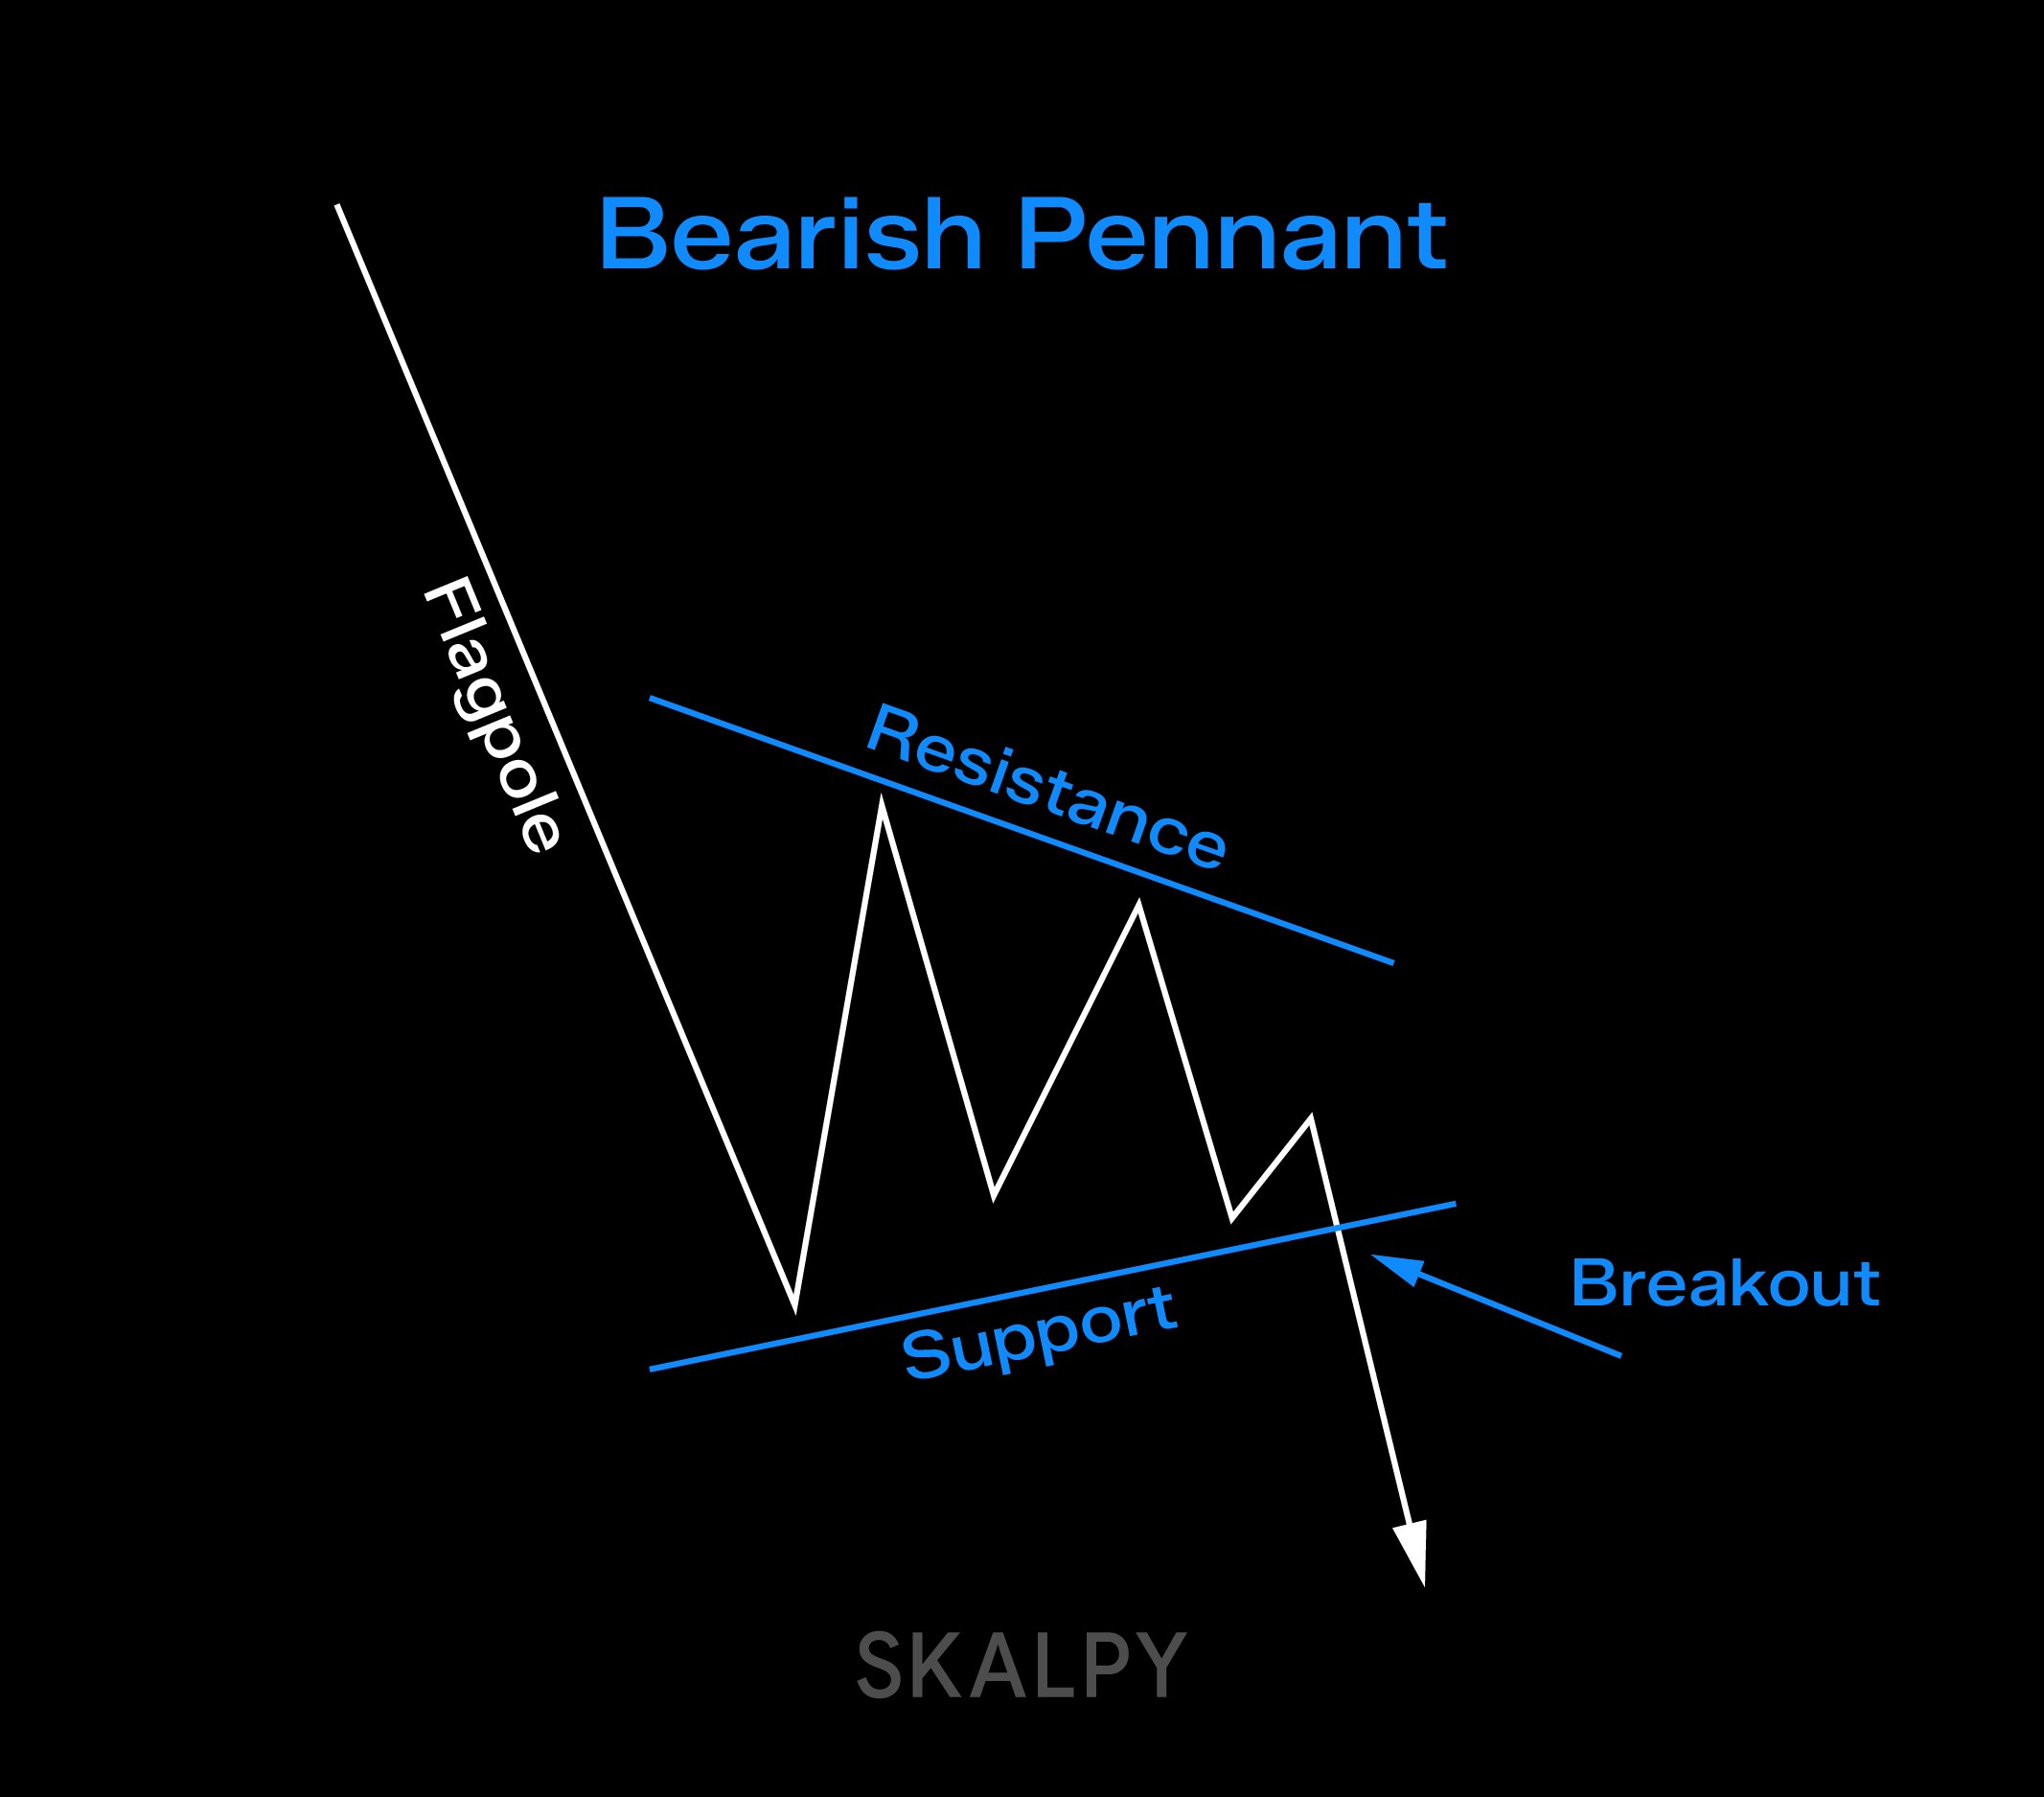
You need three things to call it a bearish pennant:
First, a sharp drop, that's your "flagpole." We're talking about a meaningful decline, not some lazy drift lower. News-driven selloffs create the best flagpoles. Fast, aggressive, emotional moves.
Second, the pennant itself. Price squeezes into a tightening triangle between two converging lines. Support slopes slightly up, resistance slopes slightly down, and they meet somewhere ahead. The key word is "symmetrical", the triangle shouldn't be tilted too much in either direction.
Third, the breakdown. Price eventually drops below that support line, suggesting the decline might continue. That's when short sellers get interested.
What Actually Makes It Work
The tighter the pennant the better. You want those lines converging fast, creating genuine compression. Loose sloppy pennants often fail because there's no real tension building up.
And that initial drop? Steeper is better. A gradual grinding decline doesn't cut it. You want fear-driven selling that creates the pole, followed by a genuine pause where bulls and bears wrestle for control inside that triangle.
The Psychology Behind It
Here's what's happening beneath the surface during each phase:
The Initial Drop (Flagpole Formation)
Sellers are in control. Maybe news hit, maybe a key support level broke, maybe institutional money decided to exit. Whatever the trigger, panic spreads. Long positions get stopped out. Fear dominates. This creates that vertical drop you need for a valid pattern.
The Consolidation (Triangle Formation)
Now things get interesting. Bulls think "oversold, time to buy the dip." They start nibbling, providing support. But sellers aren't done, they're just pausing, taking profits on shorts waiting for the next leg down. Some are even adding to positions during brief rallies to resistance.
This creates the triangle. Neither side has decisive control. Volatility drops. Volume typically decreases. It's the calm before the potential storm.
The Breakdown
Sellers regain control. Maybe another news catalyst hits, maybe buyers just give up, maybe fresh shorts pile in. The support line breaks, stops get triggered below it, and momentum shifts decisively lower. Bulls who bought the dip realize they're trapped. That's your signal.
How to Actually Trade This Pattern
Getting Your Entry Right
You've got choices, none perfect:
Option 1: Set a sell-stop order just below that support line. Pro: you catch the move early. Con: you might get faked out by a quick dip that reverses.
Option 2: Wait for a candle to close below support. More conservative. You miss the initial move but avoid some false breakdowns.
Option 3: Enter after a "throwback" where price breaks down, rallies back to test the broken support (now resistance), then continues lower. Safest approach but you might miss the entire move waiting for a retest that never comes.
Pick what fits your personality and stick with it. Consistency matters more than which specific method you choose. For traders looking to execute these strategies efficiently across multiple markets, Skaply, a fast cross-platform trading terminal, offers tools designed for quick pattern identification and trade execution.
Where to Put Your Stop
Two main approaches:
Put it above the resistance line. Simple, logical. If price breaks back into the pennant heading up, you were wrong.
Or place it above the most recent high within the pennant - usually right before the breakdown. Tighter stop, smaller risk, but higher chance of getting stopped out by noise.
Some traders also use volume-based reference points like the Point of Control from Market Profile. That high-volume node can act as a logical stop level.
Setting Your Target
Classic method: measure the flagpole's height (from top to bottom of that initial drop) and project it downward from where support broke. So if the pole was 100 points tall, you're looking for another 100 points down from the breakdown level.
Alternative: just trail your stop and let the market tell you when it's done. Sometimes you'll make more, sometimes less. At least you're not guessing at arbitrary targets.
The appeal of this pattern is the risk-reward. A tight pennant with a tall flagpole gives you a small risk area (the pennant height) against a potentially large reward (the flagpole length projected down). That's what makes it attractive.
Volume: The Confirmation You Need
Volume tells you if the breakdown is real or just noise. Real breakdowns come with volume spikes. Sellers are actively pushing price lower, not just a lack of buyers letting it drift.
Low volume breakdowns? Be skeptical. They often fail and reverse back into the pennant range. Don't trust them.
Footprint charts and delta analysis add another layer. When you see heavy selling (negative delta) at the breakdown, clusters of aggressive market sells overwhelming the order book, that's confirmation. When the breakdown happens quietly with minimal selling pressure, that's a red flag.
Market Profile helps too. If the breakdown occurs from a low-volume area and accelerates through a high-volume zone, momentum is real. If it stalls at a high-volume node, be careful, that's where buyers might step in.
Real Examples Across Different Markets
Stock Market Application
Bearish pennants form regularly on individual stocks, especially after earnings misses or sector-wide selloffs. The pattern often plays out within a single trading day on intraday charts.
One challenge with stocks: gaps. The market closes, news hits overnight, and the stock gaps down at the open. Your carefully placed stop might execute at a much worse price than planned. Factor that risk in.
Futures Trading
Futures markets offer nearly 24-hour trading, so patterns develop more smoothly without gap risk. You'll see bearish pennants on index futures during market corrections, on commodity futures reacting to supply/demand shifts, on currency futures during central bank policy changes.
The liquidity in major futures contracts means tighter spreads and cleaner breakdowns. Patterns tend to behave more "textbook" compared to thinly traded stocks.
Crypto Markets
Cryptocurrency charts are bearish pennant factories. The high volatility creates those sharp drops needed for flagpoles. The 24/7 trading means pennants form and resolve without interruption.
But crypto's volatility cuts both ways. False breakdowns are more common. The pattern might look perfect, break down convincingly, then whipsaw back up within minutes. Risk management is even more critical here.
When Things Go Wrong
Not every breakdown works. You need to recognize failure quickly.
False Breakdown Signals:
Price breaks below support but closes back above it - classic bull trap for short sellers.
Volume doesn't increase on the breakdown - suggests weak conviction.
Delta stays neutral or even positive despite the price drop - buyers are absorbing the selling, not capitulating.
Immediate rejection back into the pennant - price broke down, hit significant support from a prior level, and bounced hard.
The Frustrating "Stop and Reverse" Scenario
Here's what really stings: price breaks down perfectly, you enter short, it drops a bit, then reverses sharply upward, stopping you out. After you're stopped, it finally continues lower just as you originally expected.
This happens. Often. It's why position sizing and risk management matter more than pattern recognition. One bad trade shouldn't hurt you significantly.
Comparing Similar Patterns
Bearish Flag vs. Bearish Pennant
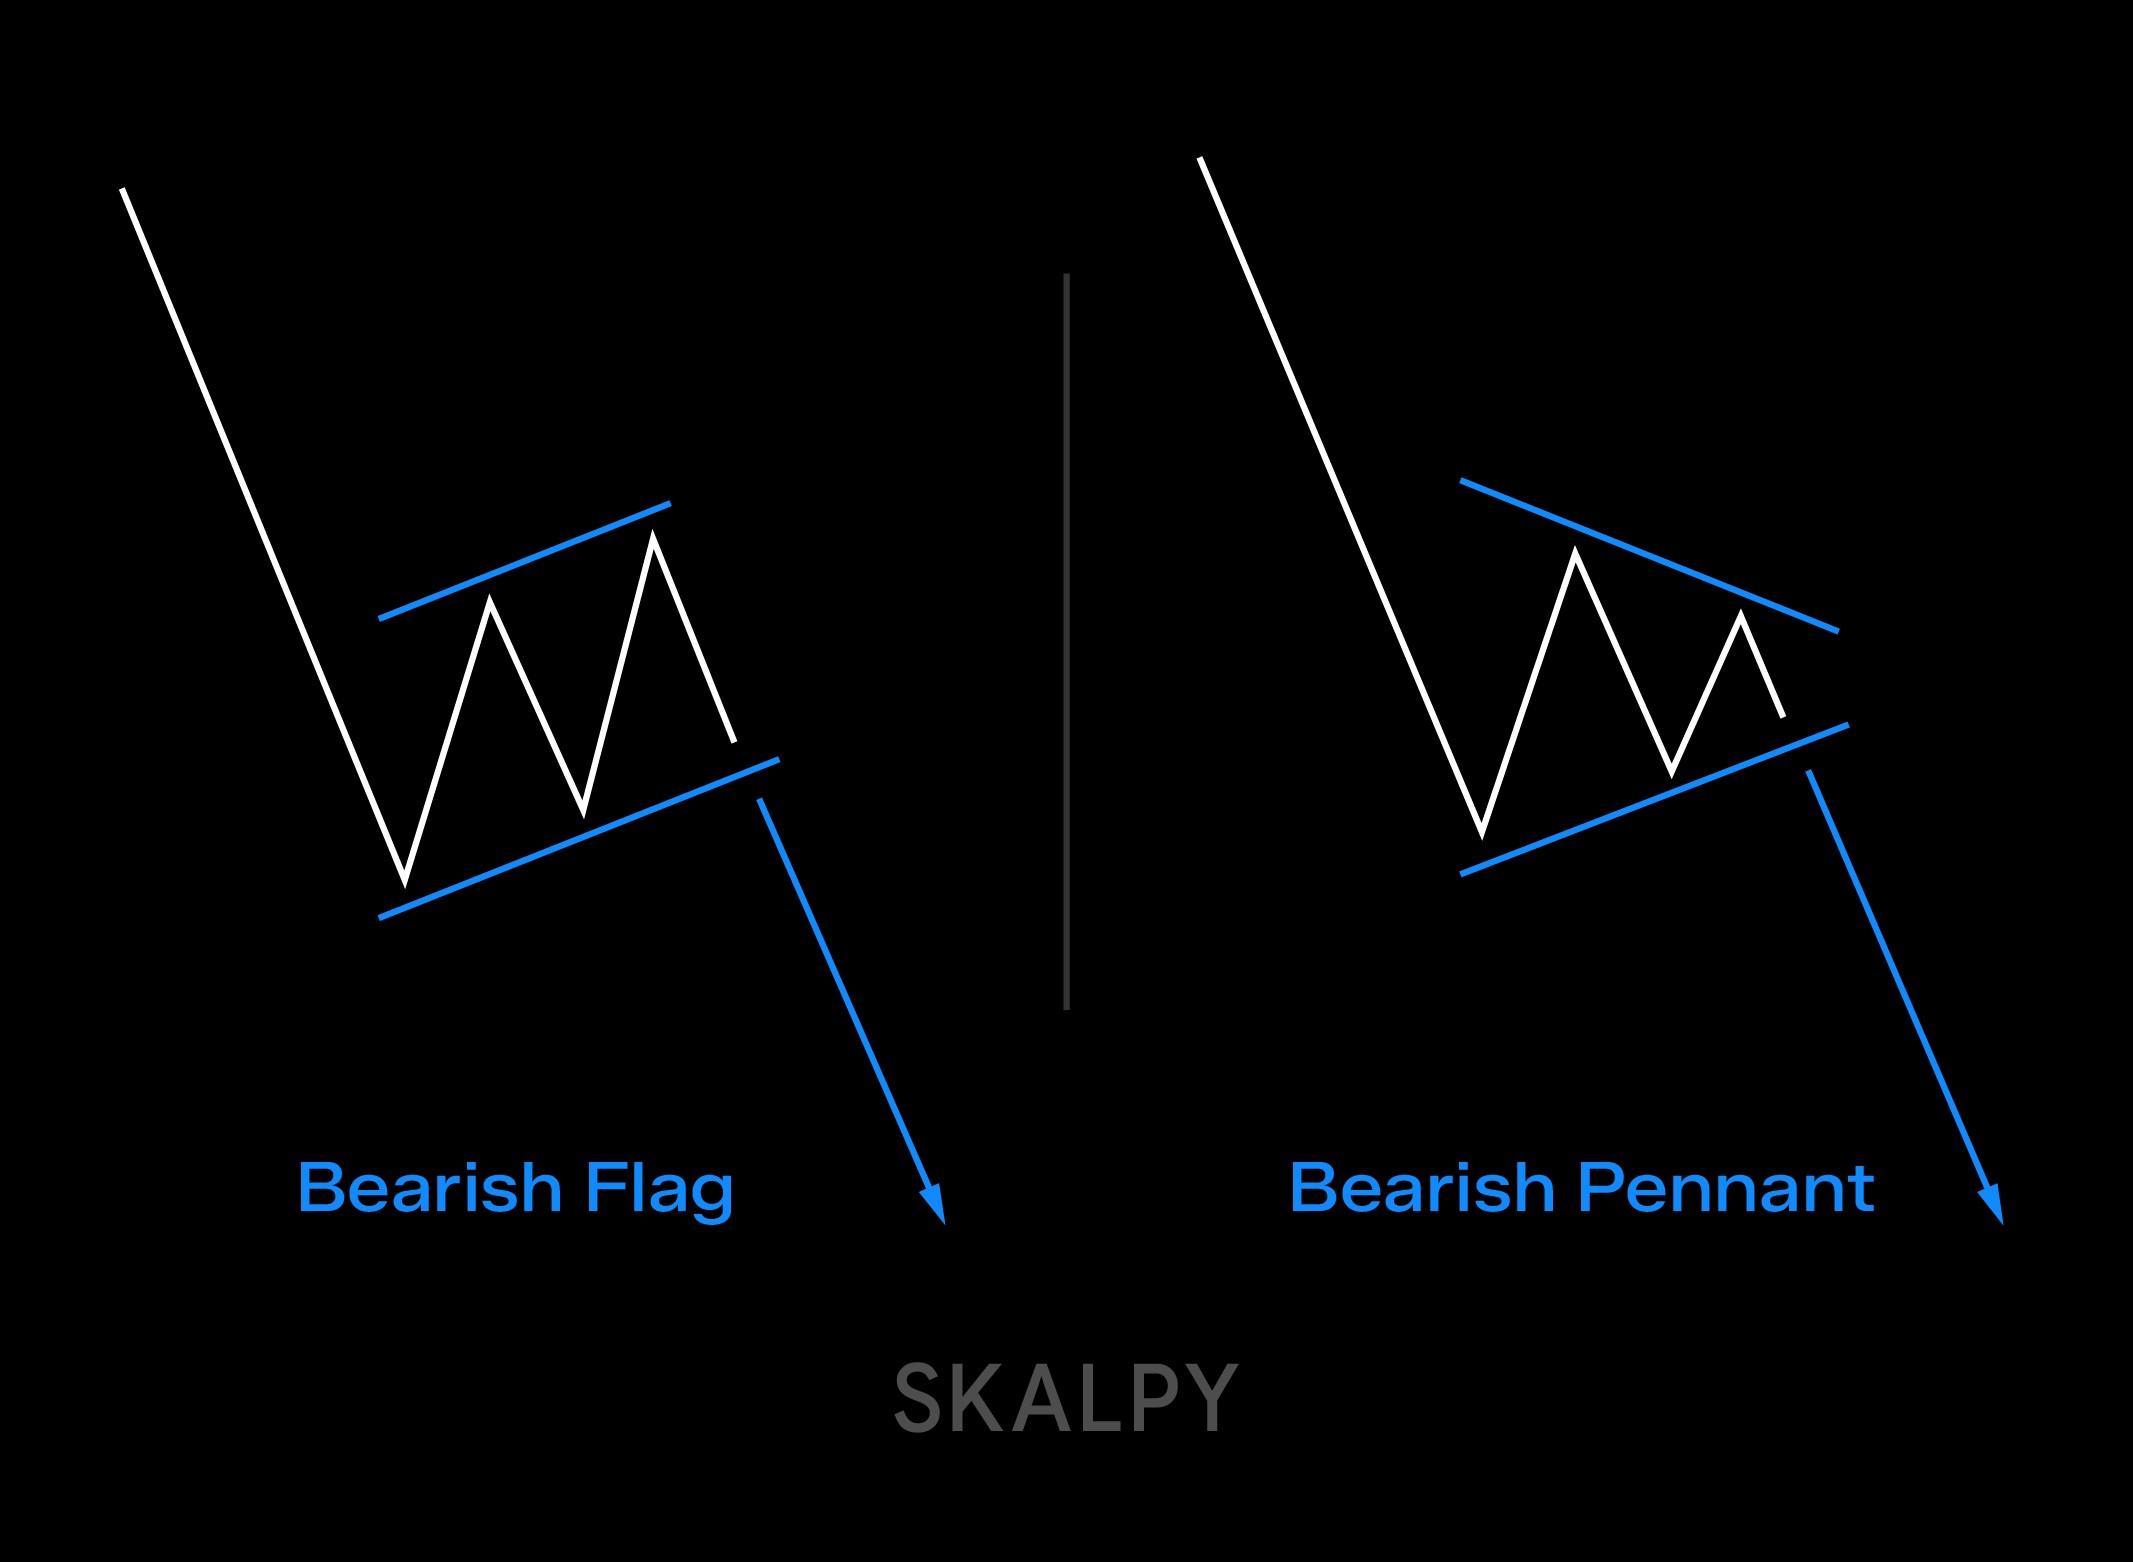
Both signal potential downtrend continuation. Both use the same flagpole measurement for targets. The difference is shape:
Flags have parallel boundaries. Two lines that stay roughly the same distance apart, usually sloping slightly upward (against the main trend).
Pennants converge. The lines meet, forming that triangle.
Functionally? They're pretty similar. Don't overthink which one you're looking at. Focus on whether the setup is clean.
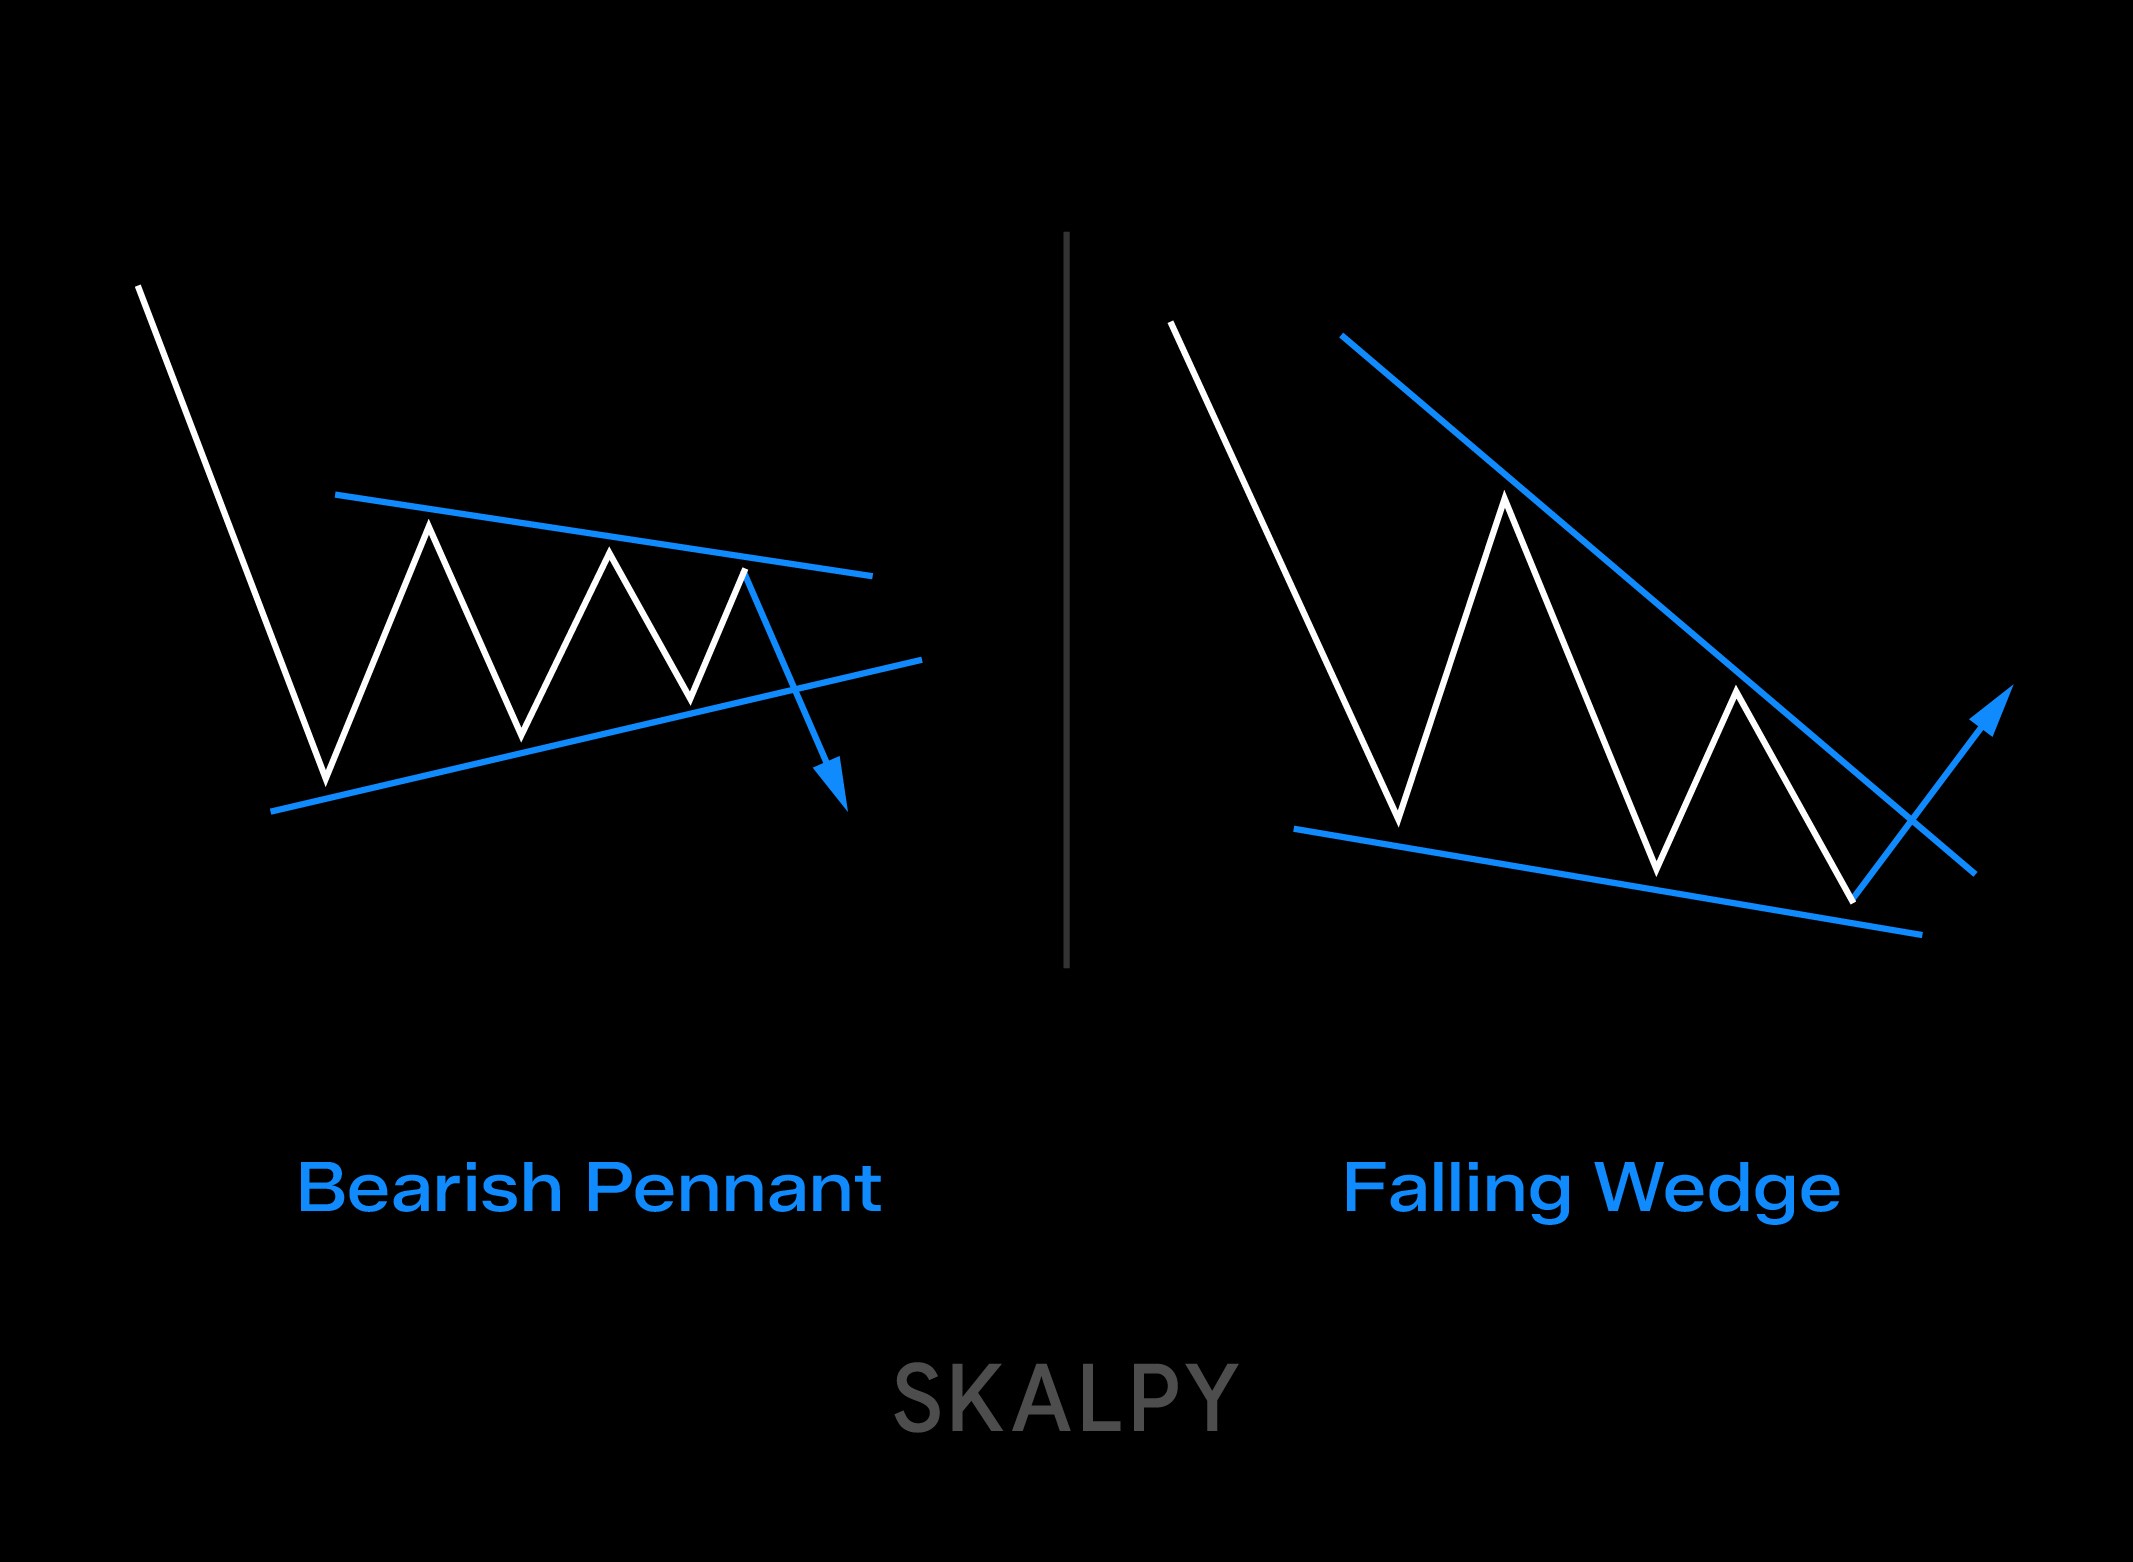
Bearish Pennant vs. Falling Wedge
Wedges also have converging lines, but they're tilted. The whole structure slopes in one direction.
In a pennant, the lines meet symmetrically around a horizontal center line.
In a descending wedge (which is often bullish despite pointing down), both lines slope downward but converge. In an ascending wedge (often bearish), both lines slope upward.
The tilt changes the interpretation entirely. Don't confuse them.
The Bullish Version
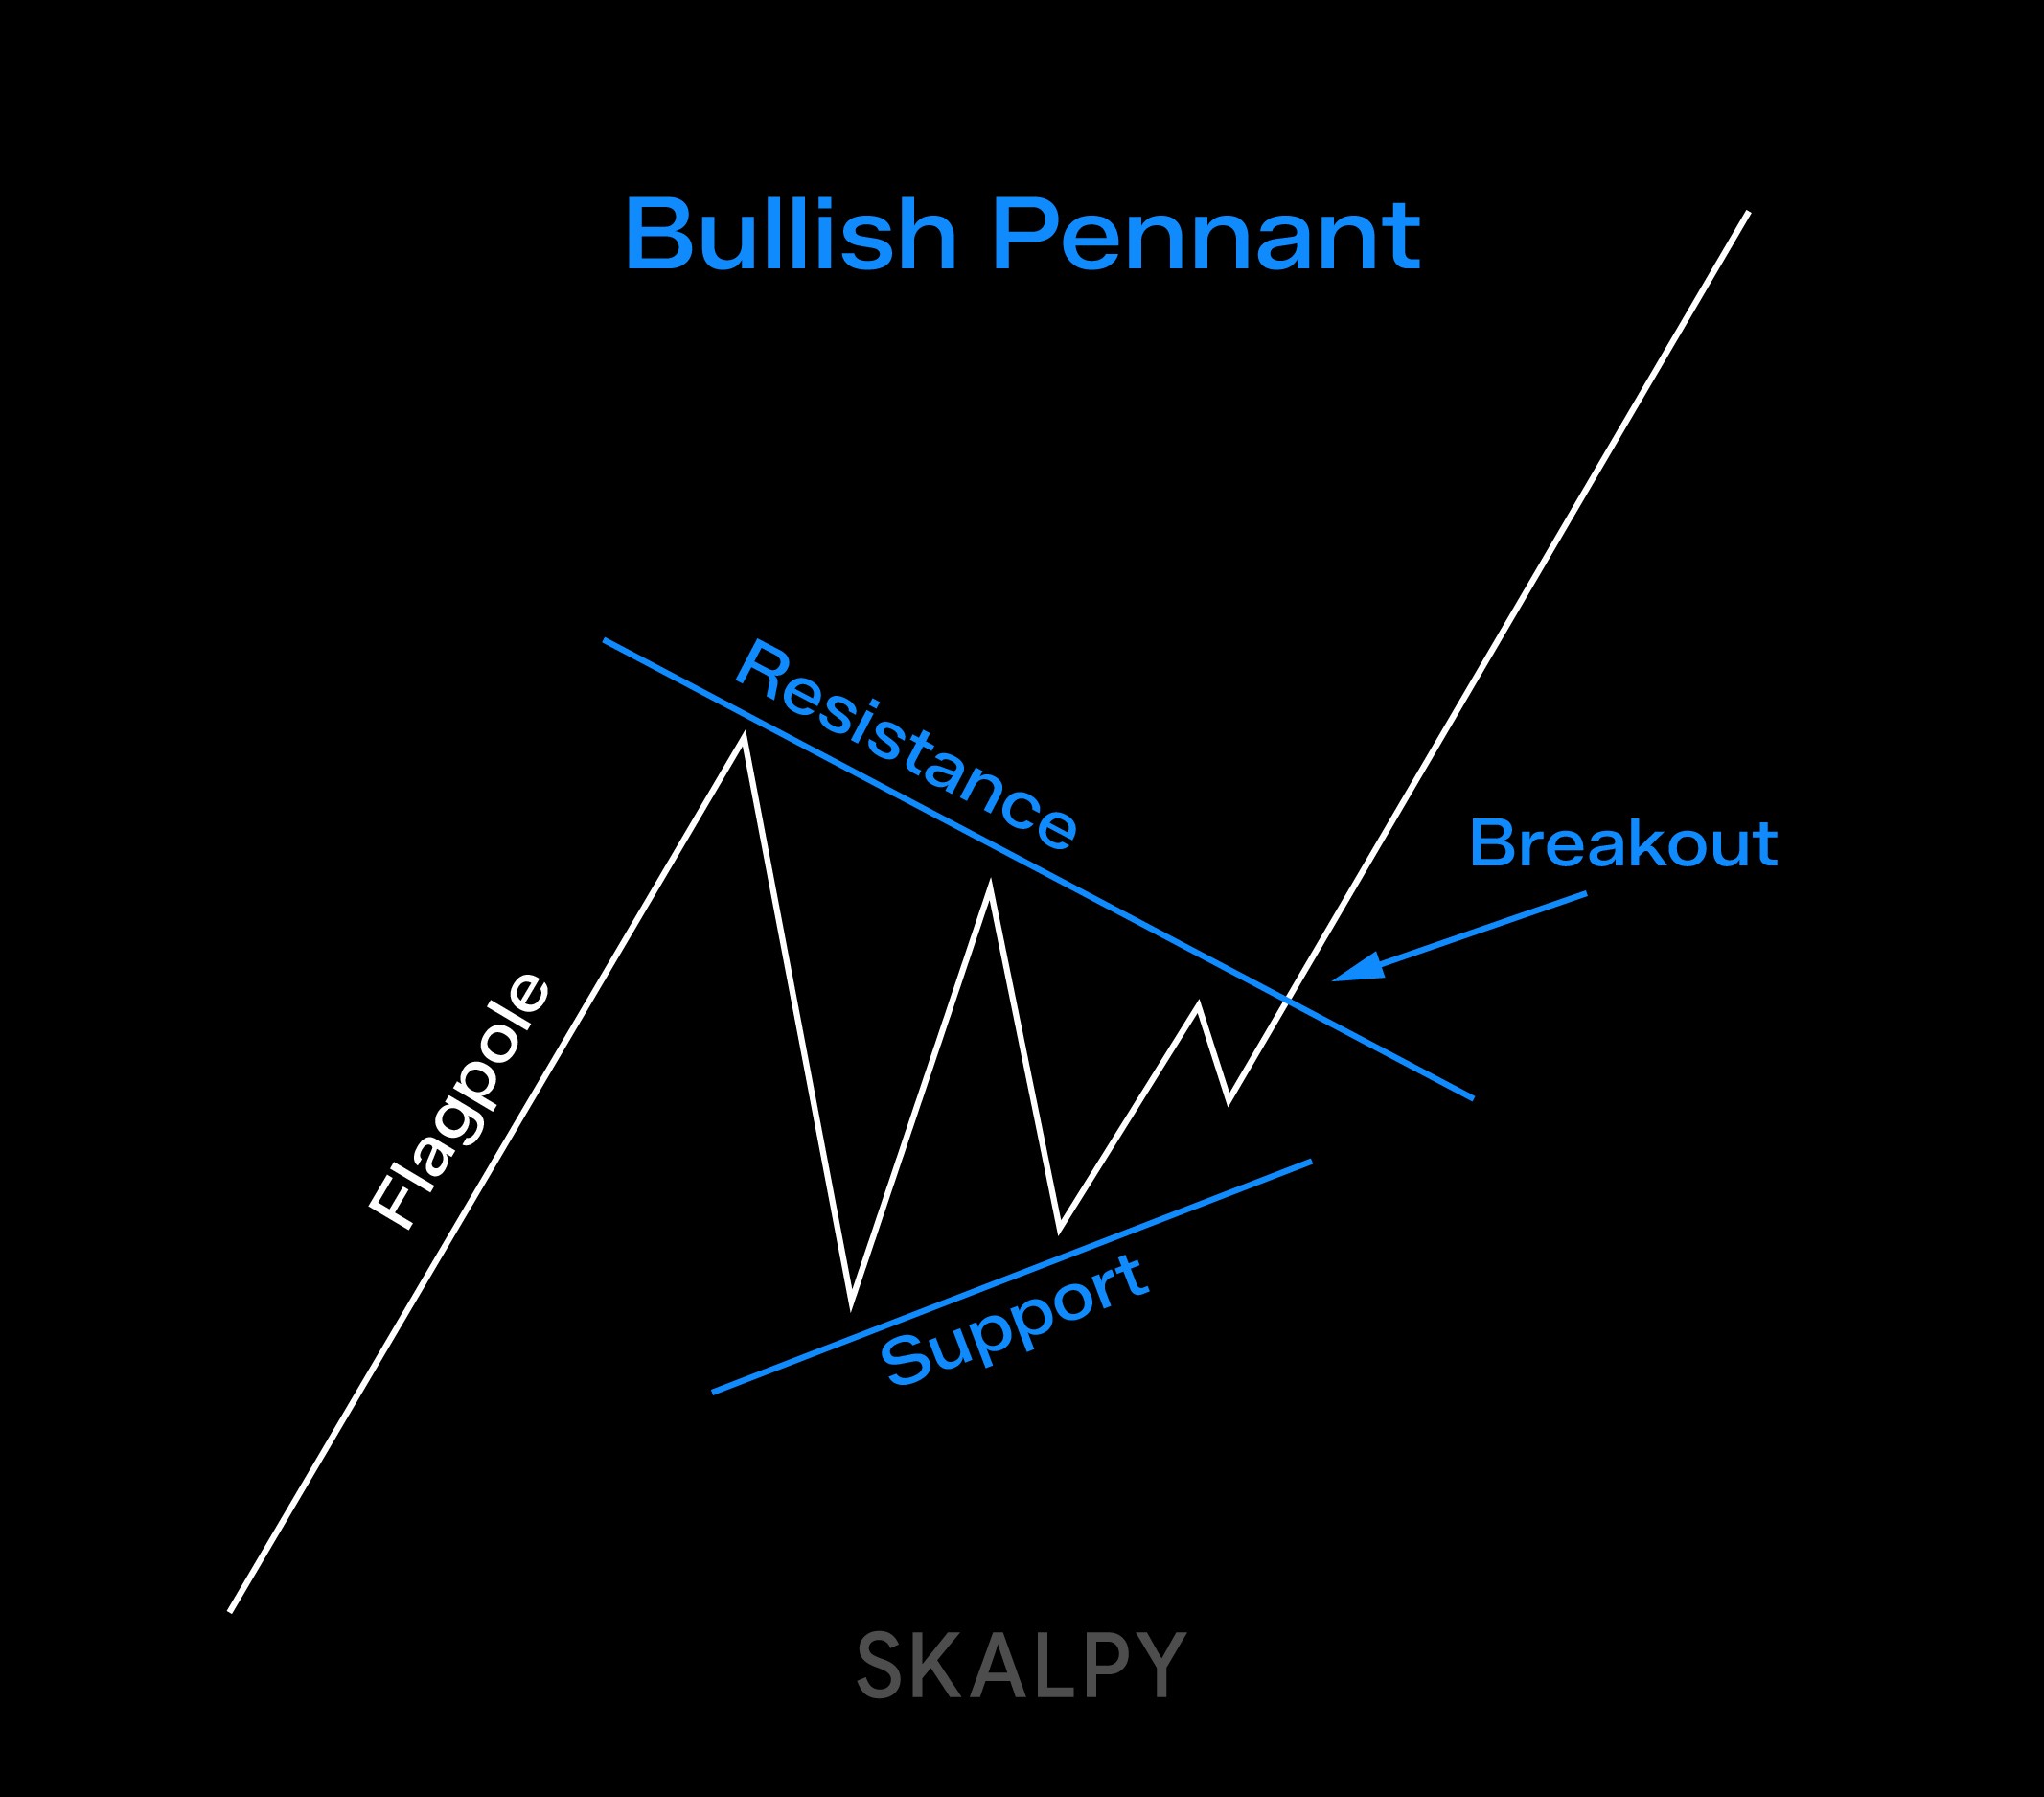
There's a bullish pennant too - exact opposite scenario. Sharp rally, consolidation triangle, continuation higher. If you understand the bearish one, you already get the bullish one. Just flip everything.
What the Data Shows
Thomas Bulkowski researched this pattern extensively. His findings: bearish pennants succeed around 55% of the time in downward breakouts. Only about 56% actually reach their measured target.
Other sources show even wider ranges: 32% to 72% success rates depending on market conditions, timeframes, and how strictly you define the pattern.
What does this tell you? The pattern isn't a guaranteed winner. It's barely better than a coin flip in some conditions. Success depends heavily on:
Overall market environment (trending vs. choppy)
Volume confirmation at the breakdown
Proper risk management regardless of pattern "perfection"
Context - where are you in the larger market cycle?
Don't trade patterns in isolation. They're tools, not crystal balls.
What Usually Causes Failures
Subjectivity Kills People
Where exactly are those support and resistance lines? Five traders will draw five different triangles on the same chart. There's no objective computer calculation - it's interpretation. And interpretation introduces error.
Timing Problems
Trading late in the session when liquidity dries up? Patterns fail more often. Trading right before major news events? Technical patterns become irrelevant instantly when headlines hit.
Ignoring Context
Found a perfect bearish pennant on your 5-minute chart while the daily chart shows a strong uptrend? Good luck with that short. Larger timeframe context matters. Always.
Chasing the Breakdown
Pattern breaks, you weren't ready, so you chase it lower. Now you're entering at the worst possible price with no clear stop level. Recipe for disaster.
The Bottom Line on This Pattern
Bearish pennants make logical sense. Markets move in waves: impulse, pause, impulse, pause. When you catch a clean pennant after a strong initial decline, you've found a decent setup with quantifiable risk-reward.
But (and this is crucial) the pattern fails regularly. Maybe half the time or more in poor conditions. You need:
Volume confirmation at the breakdown
Awareness of where you are in the bigger picture
Proper stop placement and position sizing
Acceptance that losses are part of the process
Use delta indicators, footprint charts, Market Profile - these aren't optional extras. They're what separate informed trading from chart pattern gambling.
And remember: this pattern works best as part of a complete strategy, not as a standalone "holy grail" signal. Combine it with solid risk management, stay aware of broader market conditions, and be ready to cut losses quickly when you're wrong.
Do all that, and the bearish pennant becomes a useful tool in your trading arsenal. Just another edge in a game where small edges compound over time. Traders interested in applying these pattern-based strategies can explore Skaply, a scalping tool designed for crypto markets.


