

Introduction
Technical traders have countless methods at their disposal to analyze market movements and forecast potential price changes. From comprehensive frameworks to specific indicators, the toolkit is extensive. Among these options, Fibonacci retracement stands out as one of the most widely adopted tools across stock, forex, and crypto markets.
What makes this technique particularly intriguing is its foundation in a mathematical sequence identified over seven centuries ago. This guide explores how traders apply Fibonacci retracement to identify key chart levels and make informed trading decisions.

What Is Fibonacci Retracement?
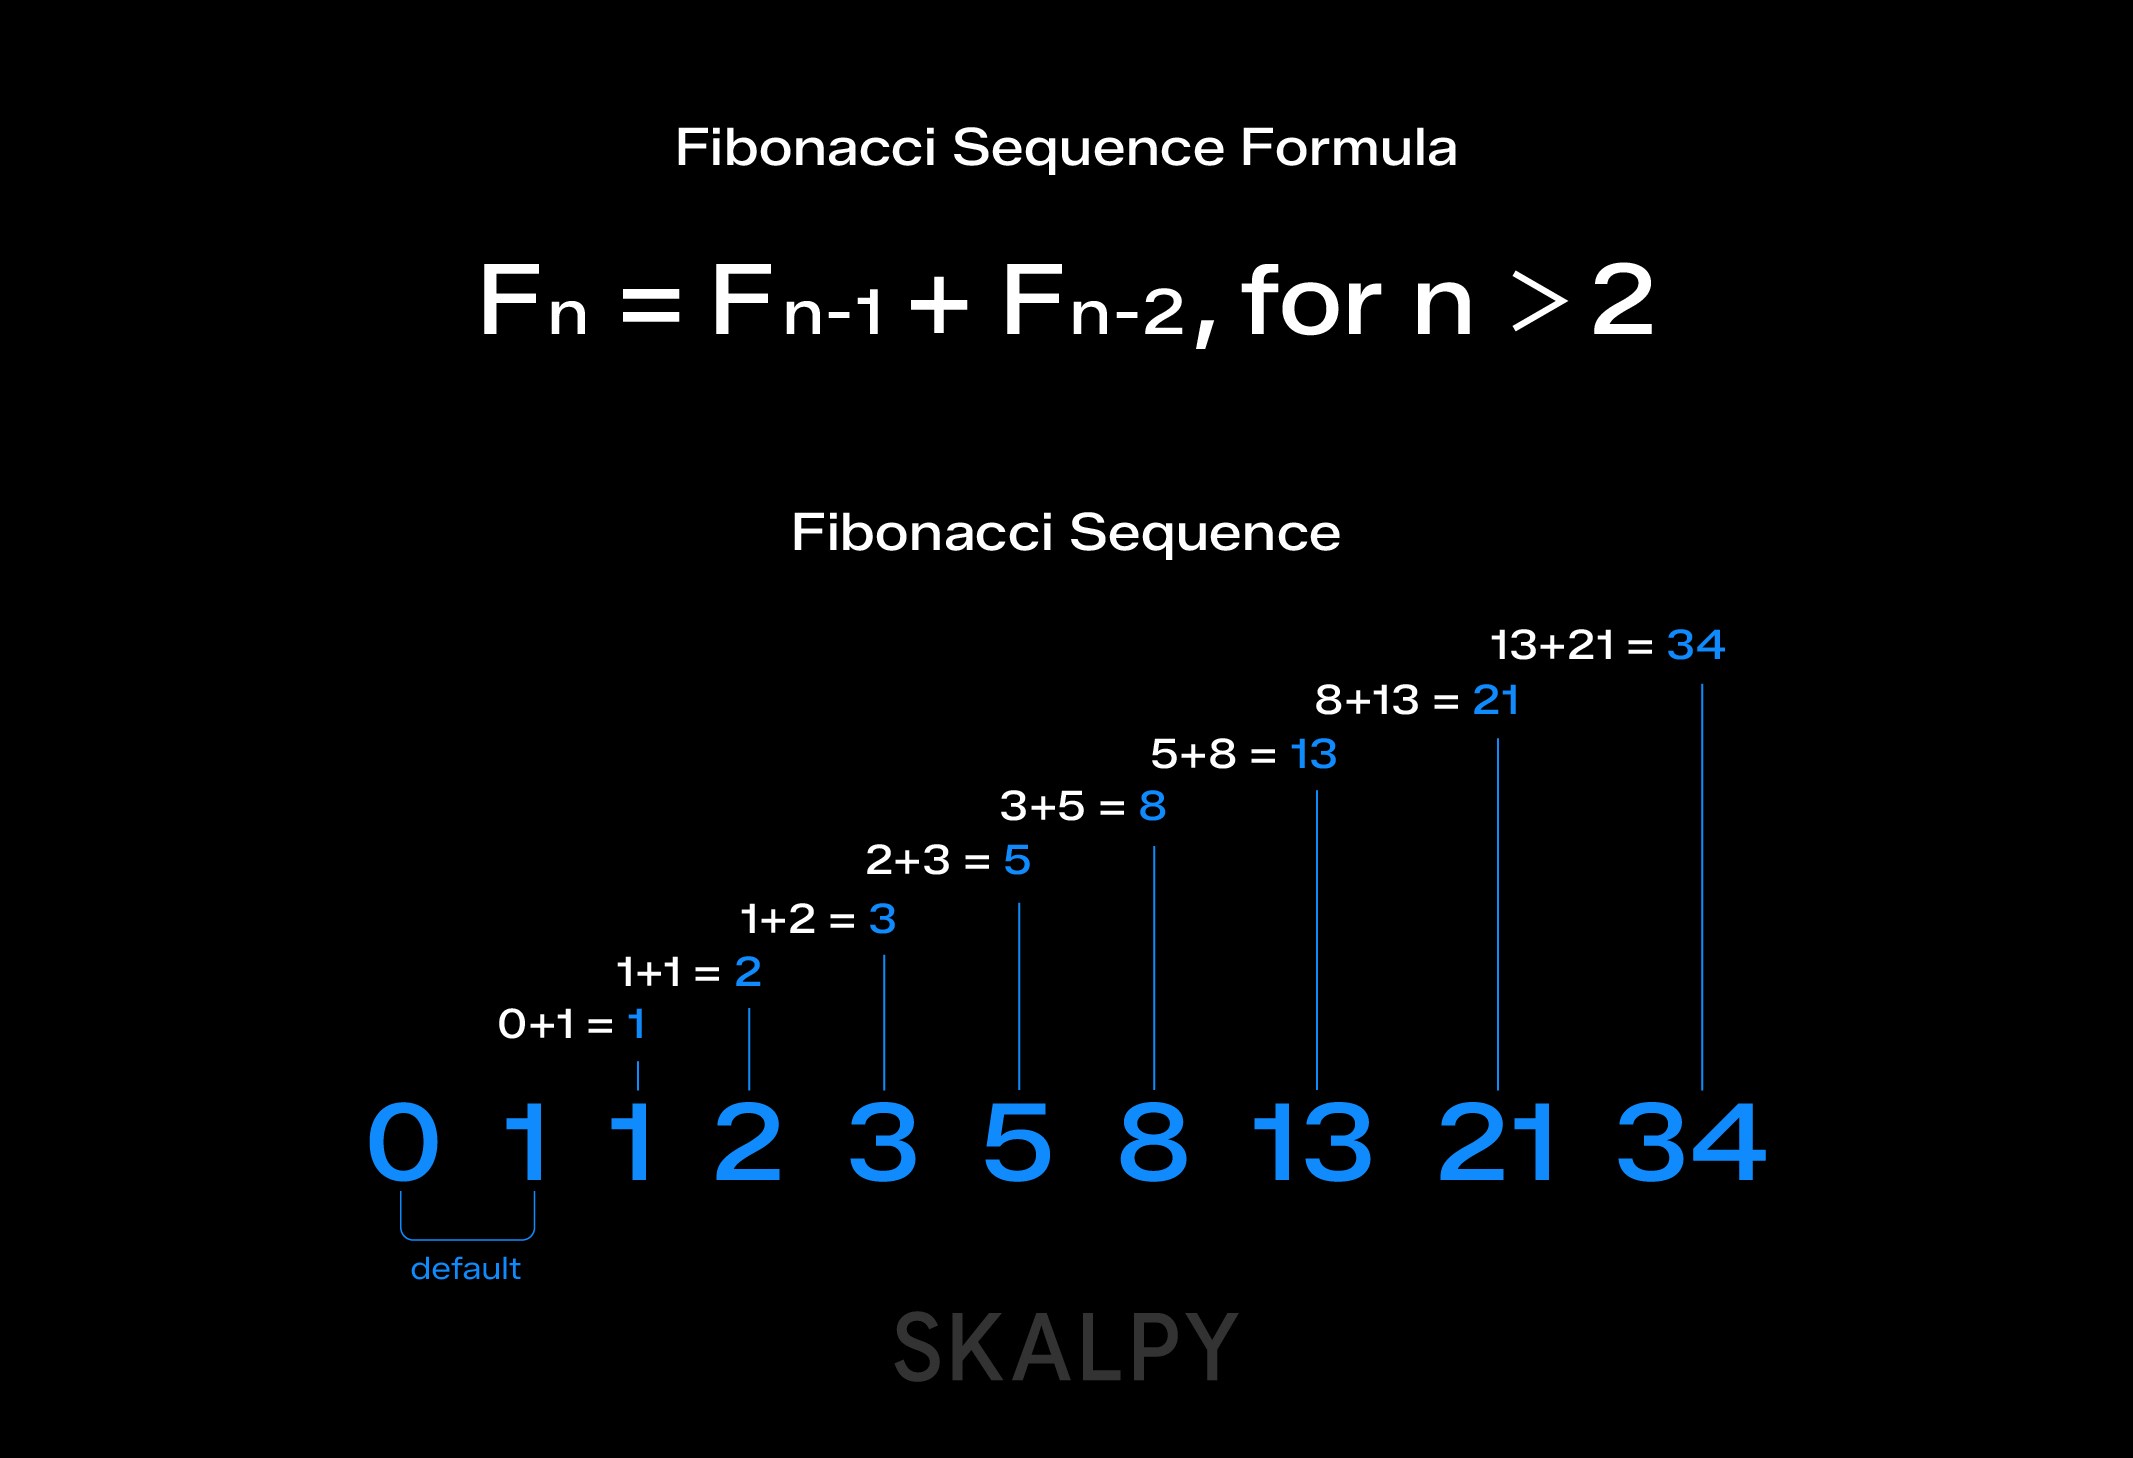
Fibonacci retracement is a technical analysis method traders use to pinpoint potential price levels of interest on trading charts. The tool applies specific ratios derived from the Fibonacci sequence - a series of numbers discovered by Leonardo Fibonacci, an Italian mathematician from the 13th century.
In this sequence, each number equals the sum of the two numbers before it: 0, 1, 1, 2, 3, 5, 8, 13, 21, 34, and so forth. Mathematical relationships within this sequence produce ratios that traders plot on price charts.
The key Fibonacci retracement levels are:
0%
23.6%
38.2%
61.8%
78.6%
100%
Many traders also include the 50% level, viewing it as significant because it marks the midpoint of a price range, even though it's not technically a Fibonacci ratio. Extended levels beyond this range, such as 161.8%, 261.8%, or 423.6% can also prove useful.
These percentage levels help traders identify critical areas like support and resistance zones, potential entry and exit points, and appropriate stop-loss placement. For traders looking to execute strategies based on these technical levels efficiently, platforms like Skaply, a fast cross-platform trading terminal, enable quick trade execution across multiple crypto markets.
The Math Behind the Levels
You won't need to calculate these percentages yourself—trading platforms handle this automatically. Still, understanding their origin adds valuable context.
When you divide any Fibonacci number by the one that follows it, the result approaches 0.618. For instance, 21 divided by 34 equals approximately 0.6176. Dividing a number by another two positions ahead yields roughly 0.382 (like 21 divided by 55, which equals 0.3818). These mathematical relationships form the basis for all Fibonacci retracement ratios.
The Golden Ratio Connection
The Golden Ratio (0.618 or 1.618) emerges directly from the Fibonacci sequence and appears throughout the natural world. From atomic structures to galaxy formations, from seashells to honeybee populations, this proportion manifests at every scale.
Artists, architects, and designers have leveraged this ratio for centuries to create visually harmonious works. Ancient pyramids, Renaissance paintings, and modern logos all incorporate these proportions. Some market analysts believe this universal ratio also influences financial market behavior.
Applying Fibonacci Retracement in Trading
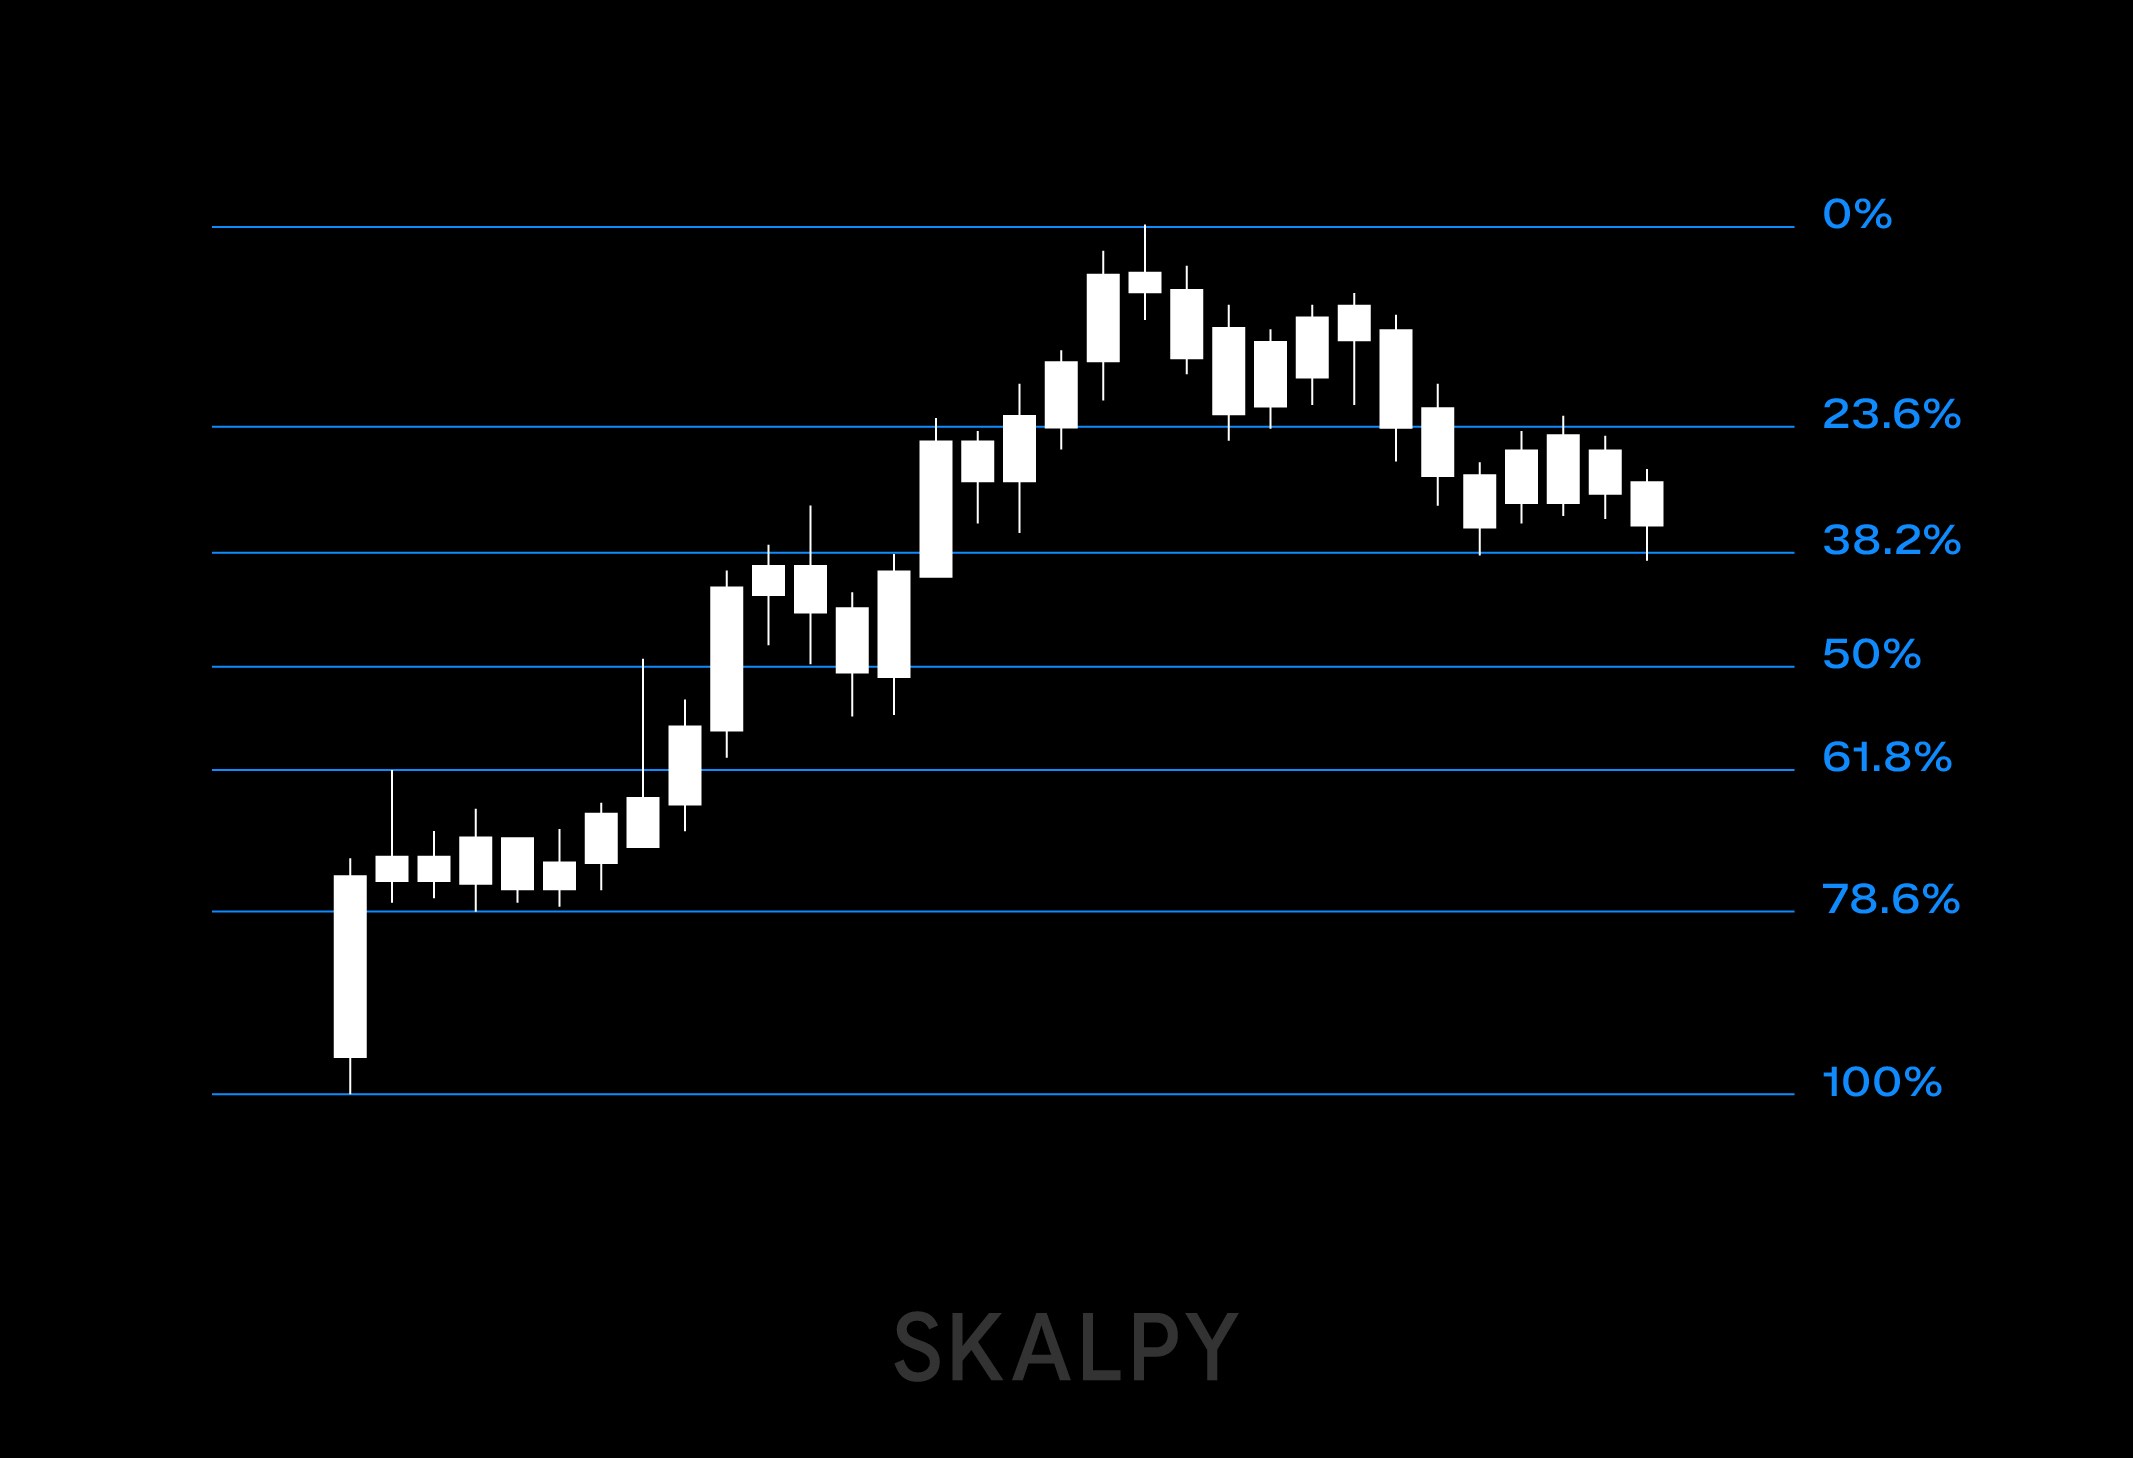
In Uptrends
Traders typically draw the Fibonacci tool between two significant price points: a major low and a major high. In an uptrend, you'd place the starting point (100%) at the low and the ending point (0%) at the high. The horizontal lines that appear represent potential support levels where the price might pause or bounce during a pullback.
This setup helps traders anticipate where a retracing market might find support before potentially resuming its upward movement.
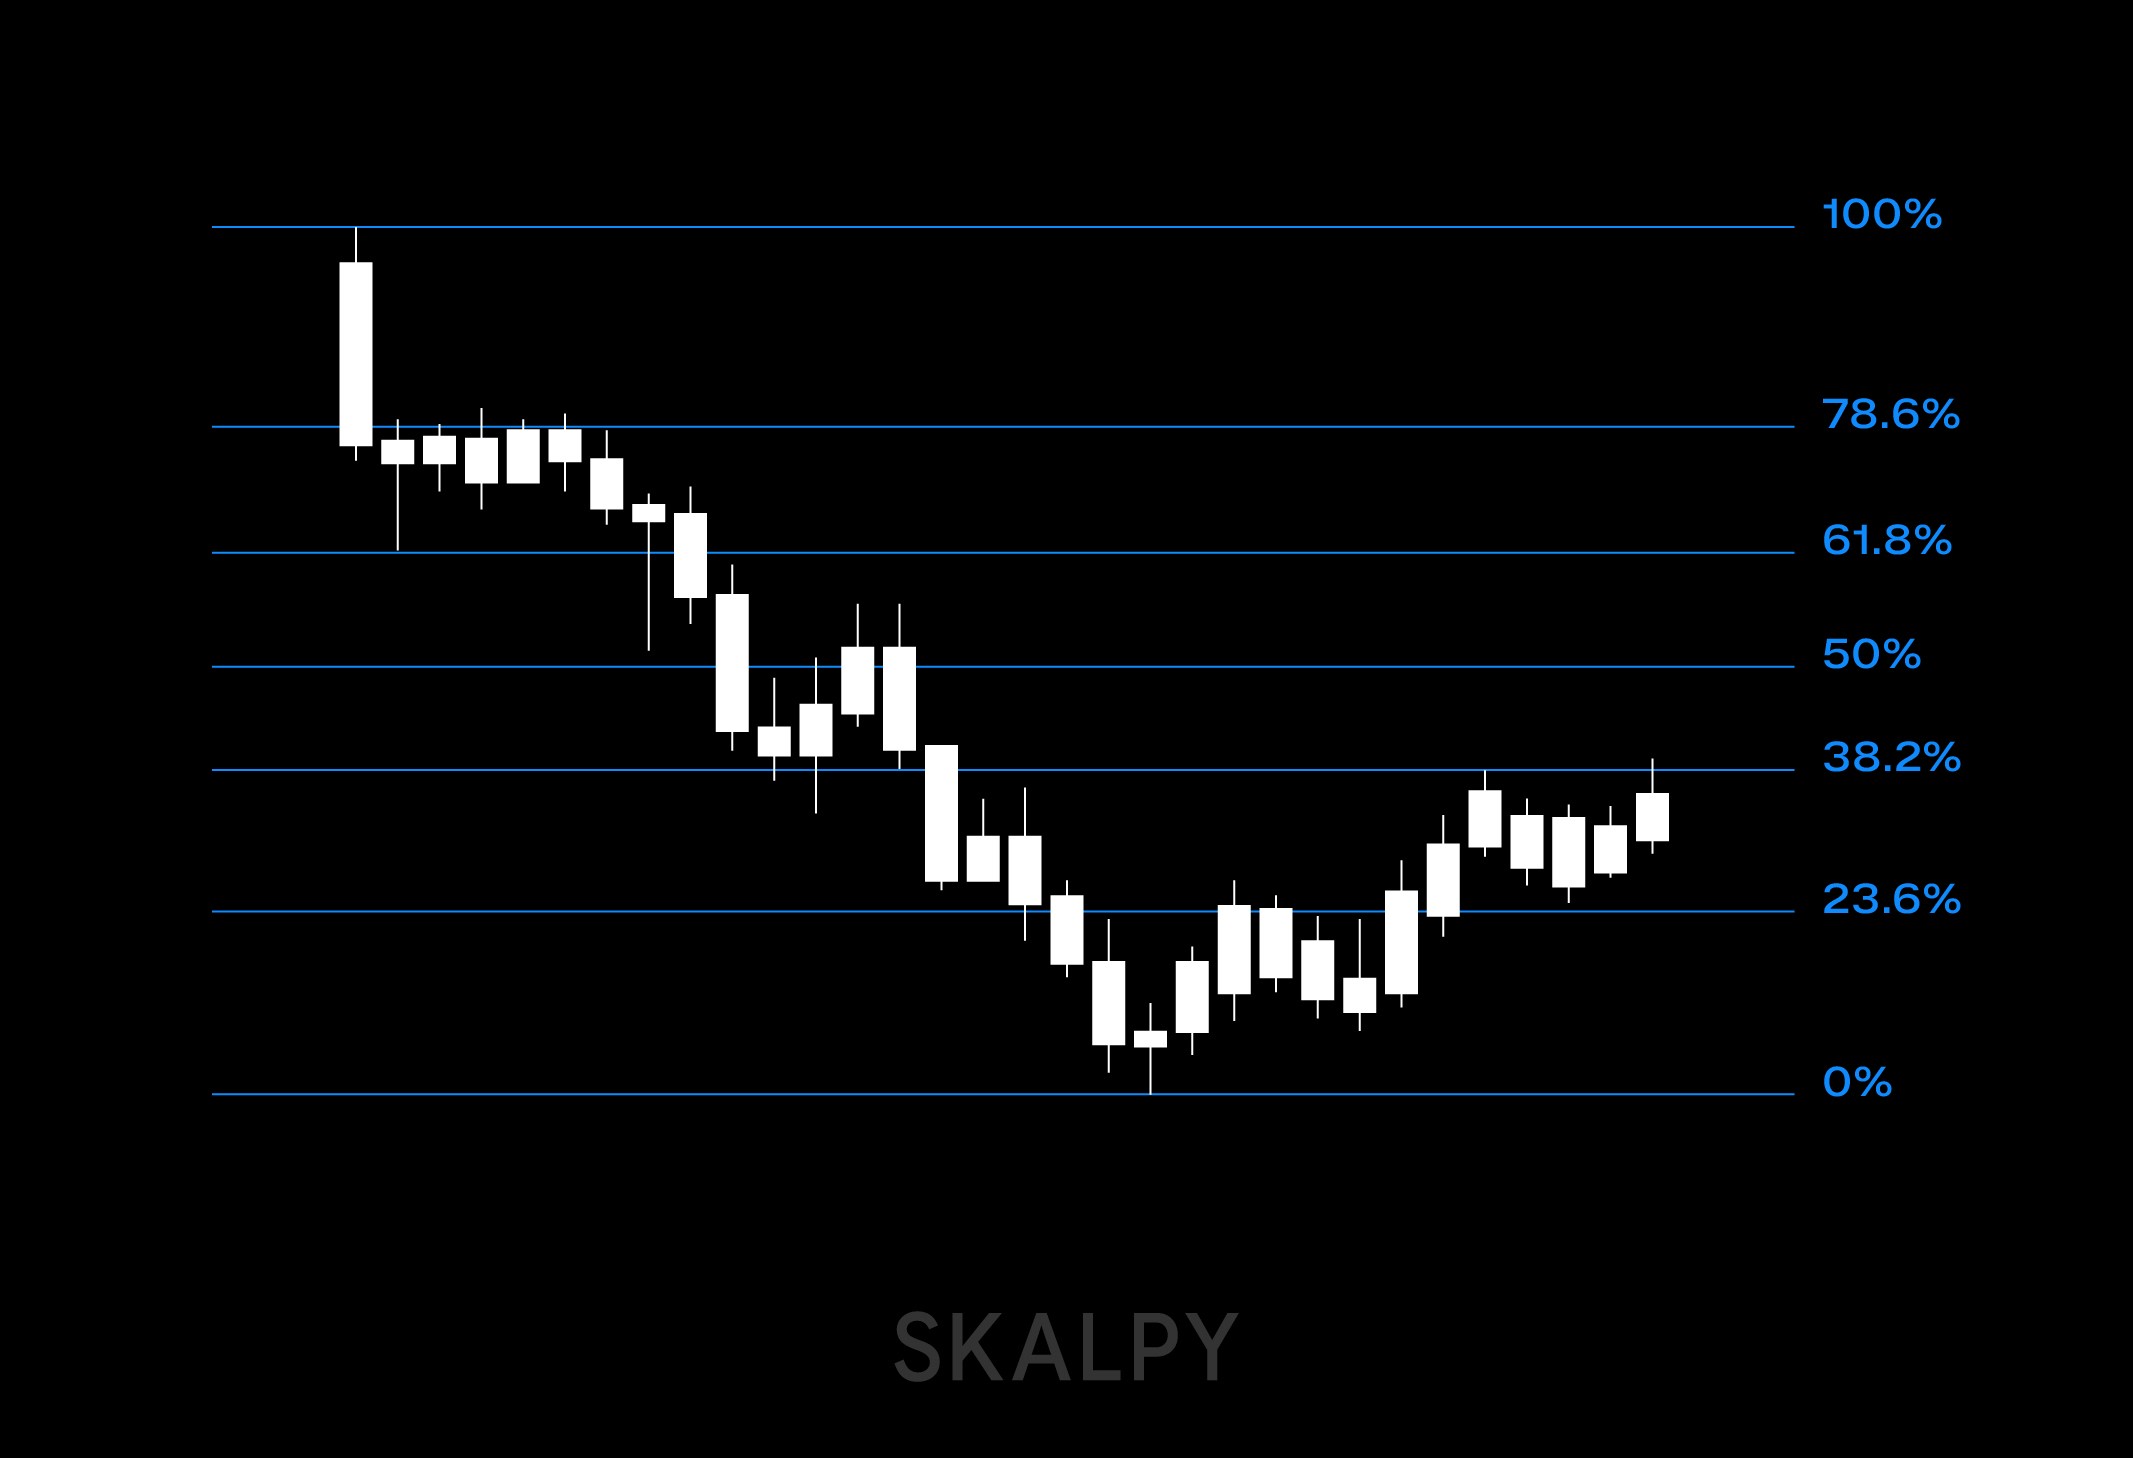
In Downtrends
The process reverses during downtrends. Here, the low point becomes 0% and the high point becomes 100%. The retracement refers to upward movement from the bottom, essentially a bounce within the overall downtrend. The Fibonacci levels in this scenario indicate potential resistance zones where the price might stall before continuing downward.
Practical Trading Strategies
Traders employ Fibonacci levels in various ways depending on their strategy and risk tolerance. Common applications include:
Range Trading: Some traders profit from movements between specific Fibonacci levels. For example, entering a position at the 38.2% retracement level during an uptrend and exiting at 23.6% can be profitable when properly executed.
Wave Analysis: Fibonacci levels pair effectively with Elliott Wave Theory, helping traders predict how far retracements might extend within different wave structures.
Confirmation Tool: Fibonacci works best when combined with other technical indicators. A price level that aligns with both a Fibonacci ratio and another indicator like a moving average or RSI signal carries more weight than either would alone.
Remember that reaching a Fibonacci level doesn't guarantee a reversal. Proper risk management remains essential, as market conditions and additional factors must inform every trading decision.
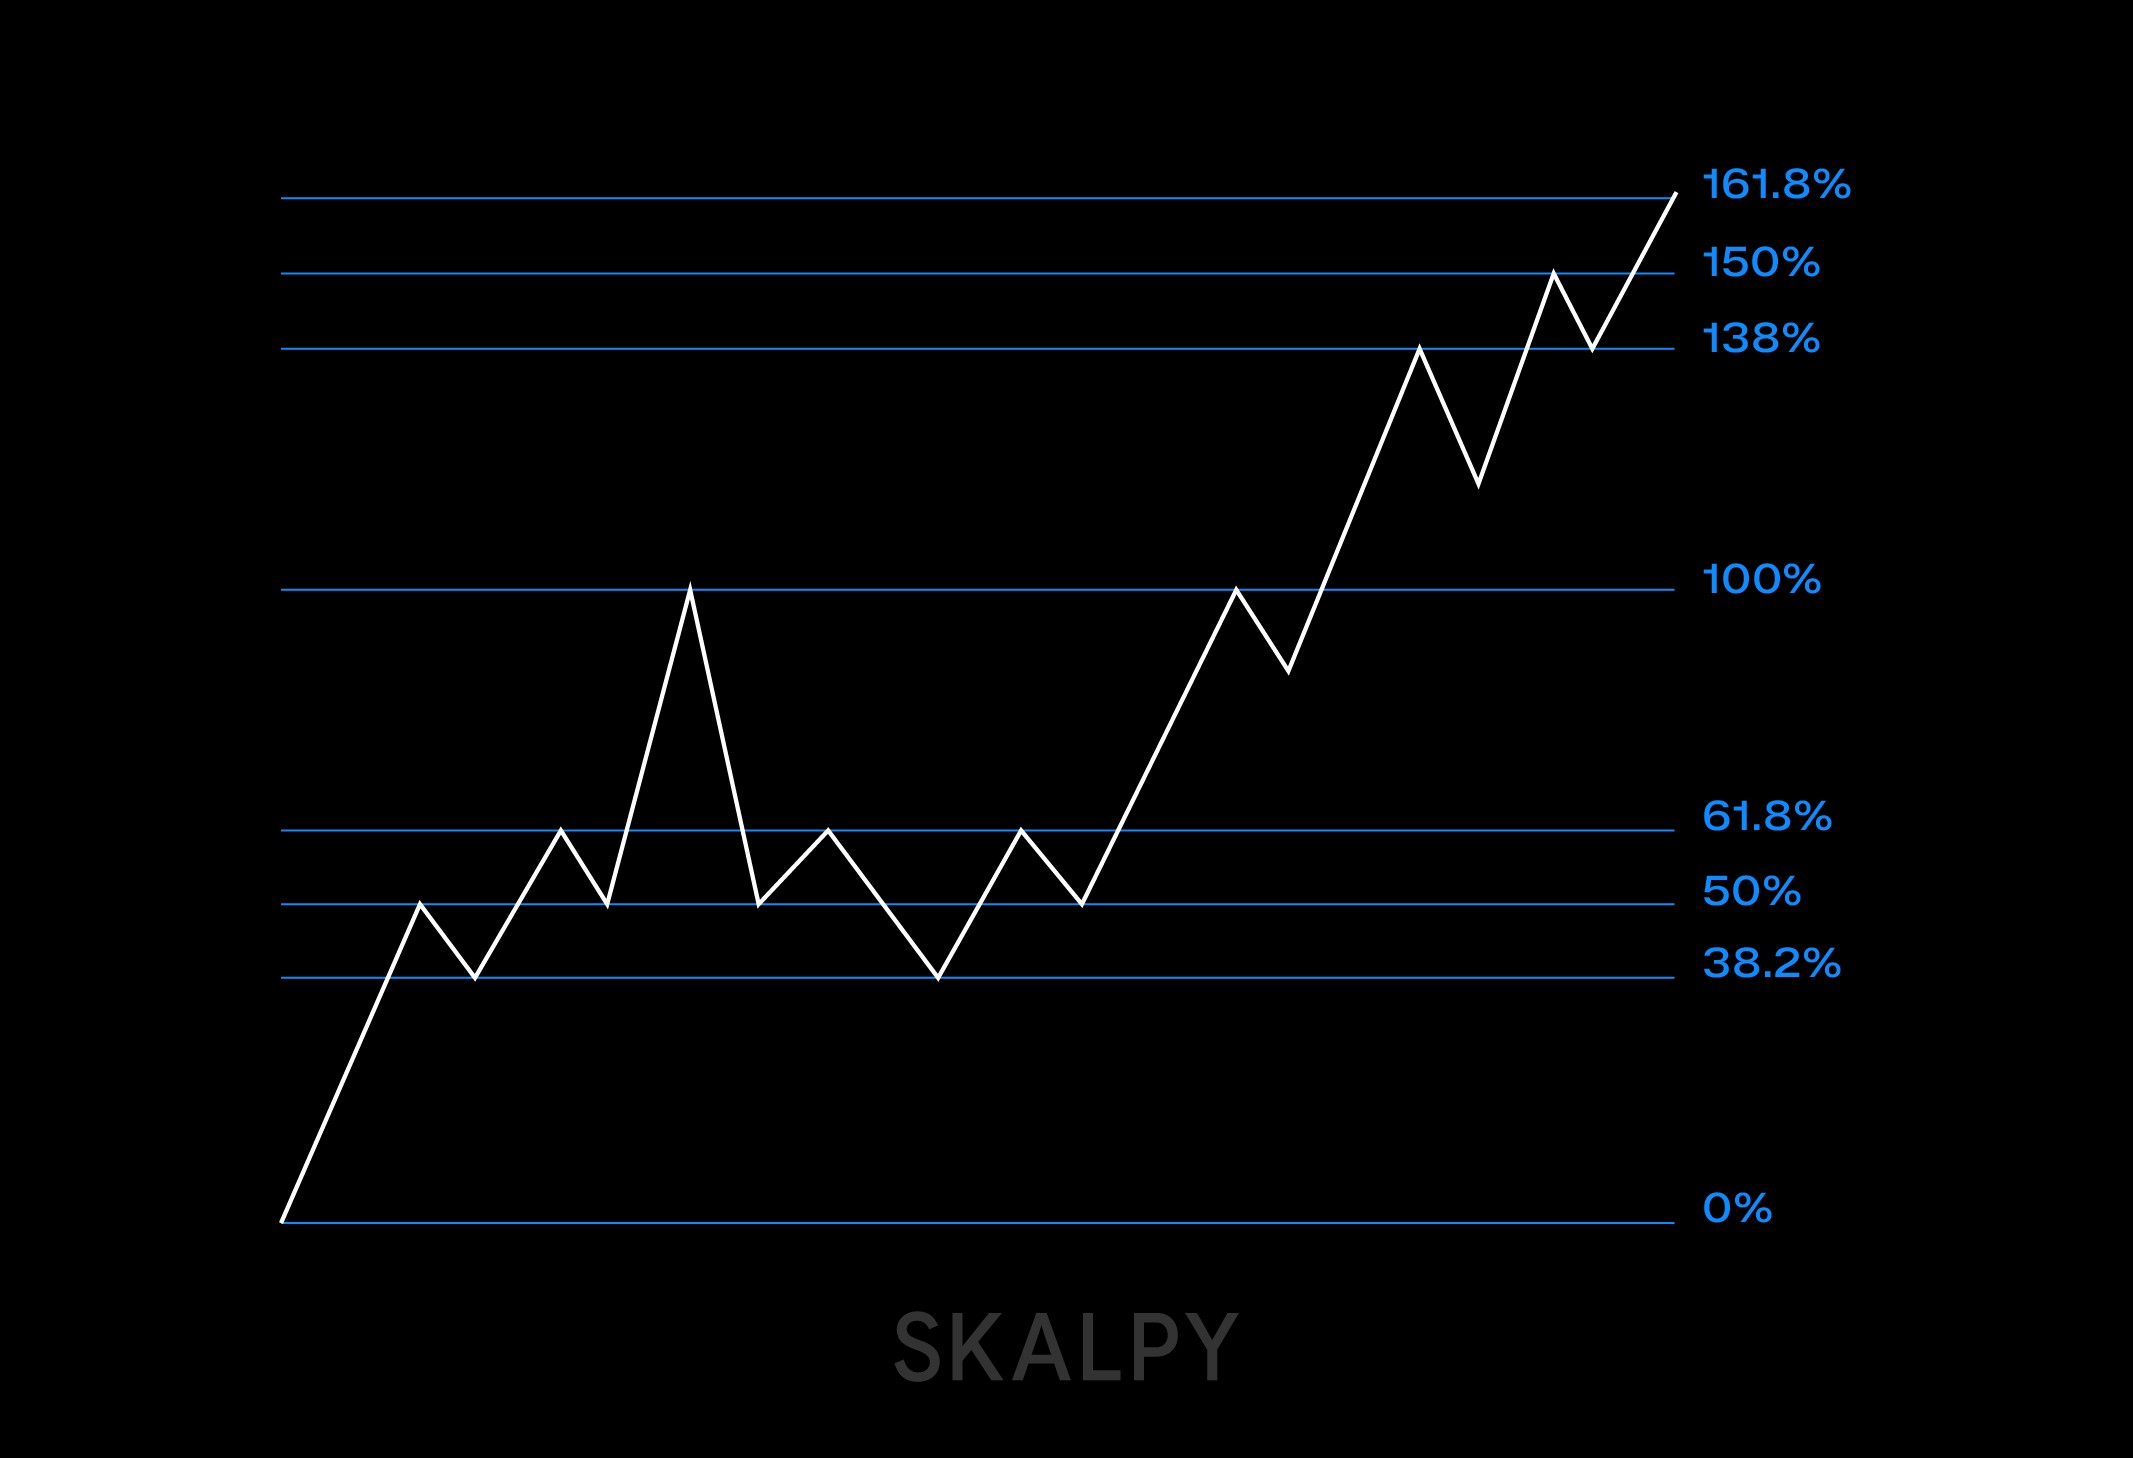
Fibonacci Extensions: Looking Beyond
While retracement levels identify potential reversal zones within an existing price range, extension levels project potential targets beyond that range. These extended levels 138.6%, 150%, 161.8%, 261.8%, and 423.6% help traders set profit targets when price moves continue past the original high or low.
Different traders prefer different extension levels as targets, and many use multiple levels to scale out of positions progressively.
Final Thoughts
The Fibonacci sequence's appearance throughout nature is fascinating, and many traders believe these patterns translate to financial markets. However, it's important to maintain perspective: technical indicators don't follow physical laws or scientific principles.
The Fibonacci retracement tool's effectiveness may largely stem from its widespread adoption when thousands of traders watch the same levels, those levels can become self-fulfilling. Whether Fibonacci ratios possess inherent predictive power or simply reflect collective market psychology, they remain a valuable component of many successful trading strategies.
The key is using Fibonacci retracement as one tool among many, always within the context of sound risk management and comprehensive market analysis.


