

Depth of Market (DOM), also called the order book, is a real-time display showing all pending buy and sell orders for an asset at different price levels. While most traders only see the current bid and ask prices, DOM reveals the entire queue of orders waiting to be executed above and below the current market price.
Think of DOM as a window into market intentions. It shows you not just where the price is now, but where significant buying and selling interest exists. This information gives you a massive advantage in understanding potential price movements before they happen.
For active traders, especially day traders and scalpers, DOM is essential. It reveals market depth, identifies support and resistance levels formed by large orders, and helps you time entries and exits with precision.
Understanding the DOM Layout
A typical DOM display is split into two sides:
The Bid Side (Buy Orders)
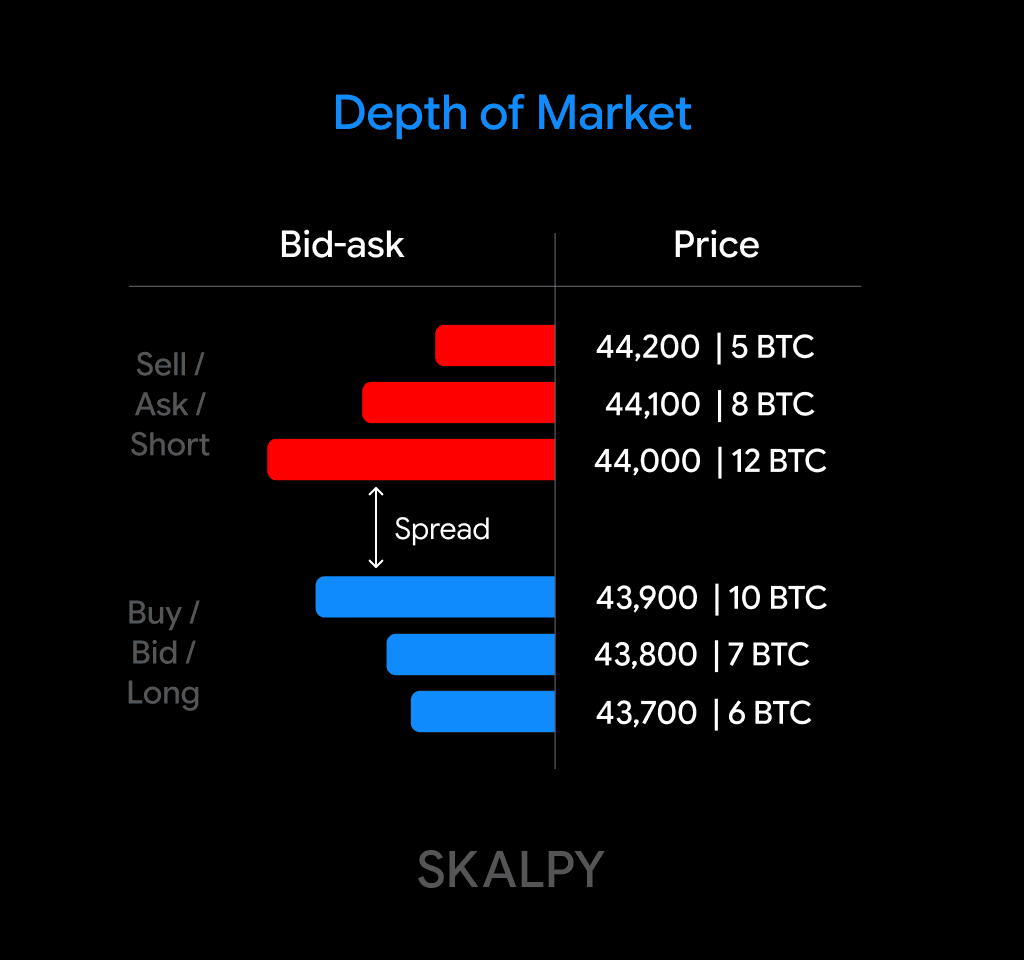
Listed on the left or in green, these are all the buy orders waiting to be filled. They're arranged from highest to lowest price. The highest bid is closest to the current market price.
The Ask Side (Sell Orders)
Listed on the right or in red, these are all the sell orders waiting to be filled. They're arranged from lowest to highest price. The lowest ask is closest to the current market price.
Between these two sides is the spread, the gap between the highest bid and lowest ask. This is where the market "lives" at any given moment.
Key DOM Components Explained
Price Levels
Each row in the DOM represents a specific price. Orders are grouped at these levels, showing total volume available at each price point.
Order Quantity
This column shows how many units (shares, contracts, or coins) are waiting to be bought or sold at each price level. Larger numbers indicate stronger interest at that price.
Cumulative Depth
Some DOM displays show cumulative volume, adding up all orders from the current price to that level. This helps you see total liquidity available within a price range.
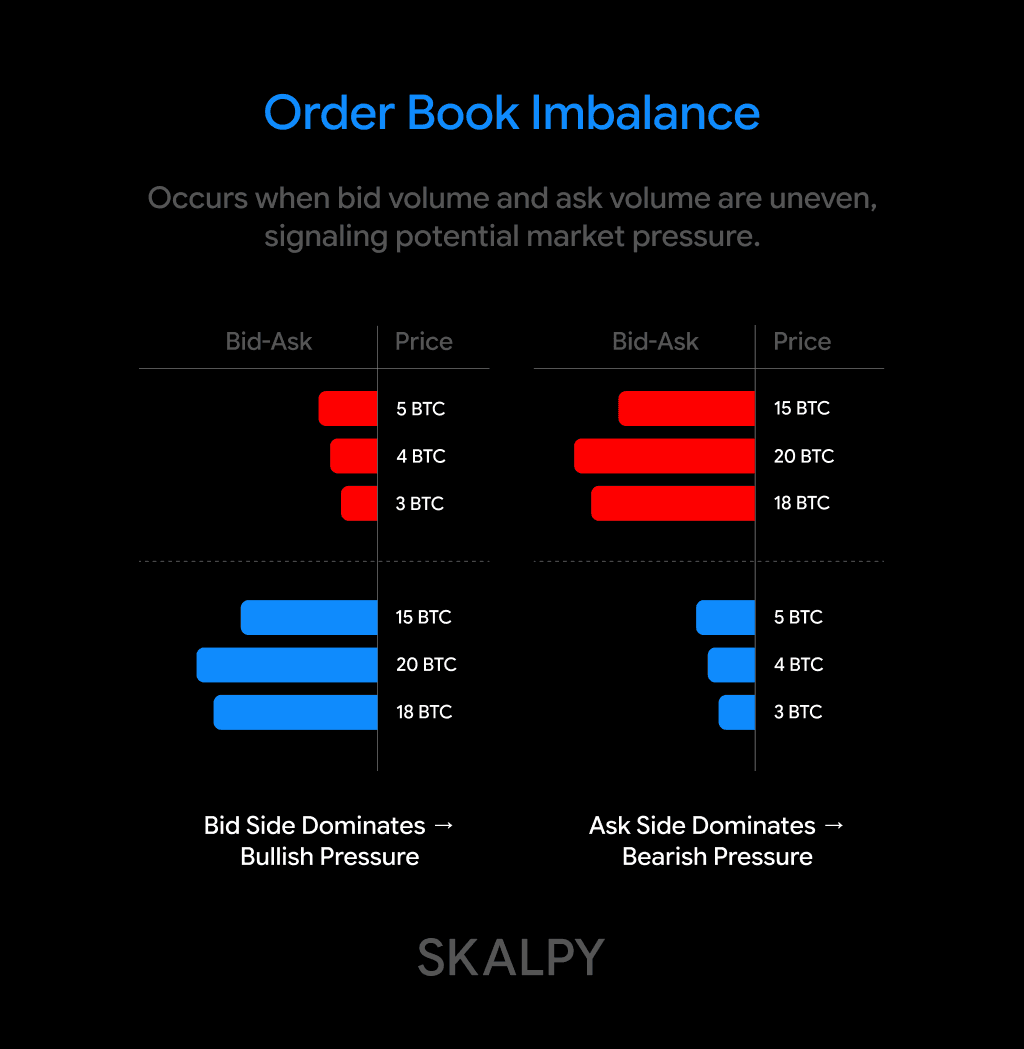
Order Book Imbalance
When one side (bid or ask) has significantly more volume than the other, it creates an imbalance. Heavy bid volume suggests upward pressure, while heavy ask volume suggests downward pressure.
Reading Market Depth: What to Look For
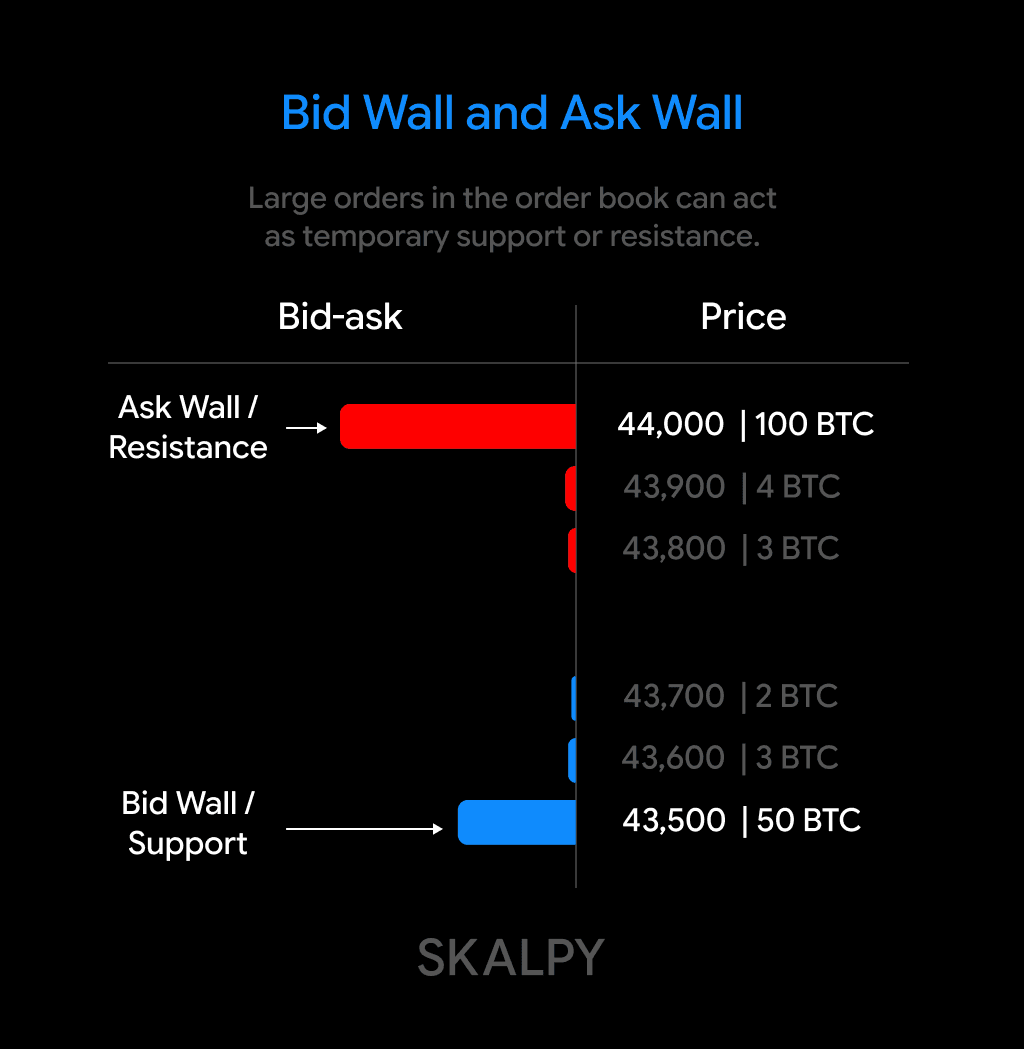
Bid and Ask Walls
A "wall" is a large order at a specific price level, significantly bigger than surrounding orders. These walls often act as temporary support (bid wall) or resistance (ask wall) levels.
Bid Wall Example:
If you see 50 BTC bid at $43,000 while most other levels show 1-5 BTC, that's a bid wall. It suggests strong buying interest and potential support at that price.
Ask Wall Example:
A large sell order at $44,000 (say 100 BTC) while other levels show 2-10 BTC creates resistance. The price might struggle to break through without significant buying pressure.
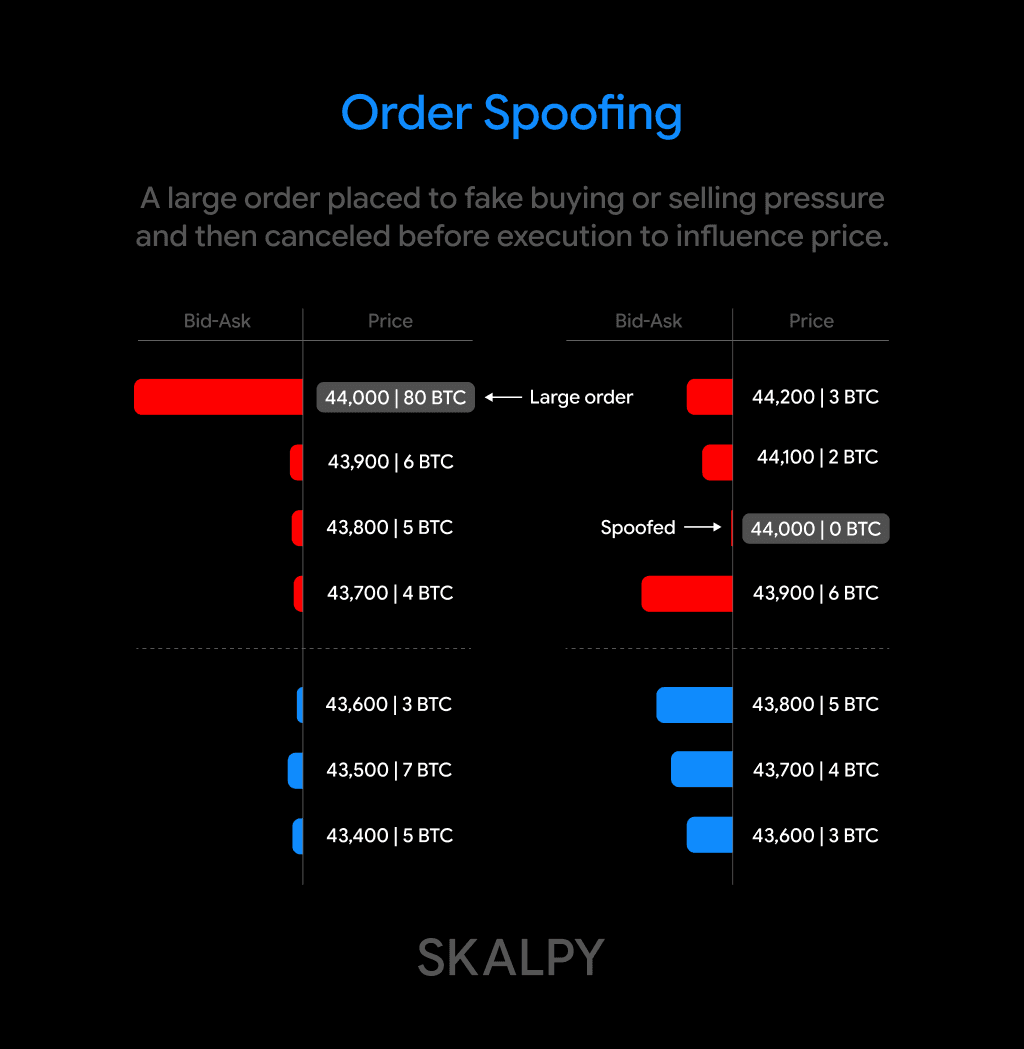
However, walls can be fake. Large orders are sometimes placed to manipulate perception and then canceled before execution. This is called "spoofing" and is illegal in regulated markets but still occurs in crypto.
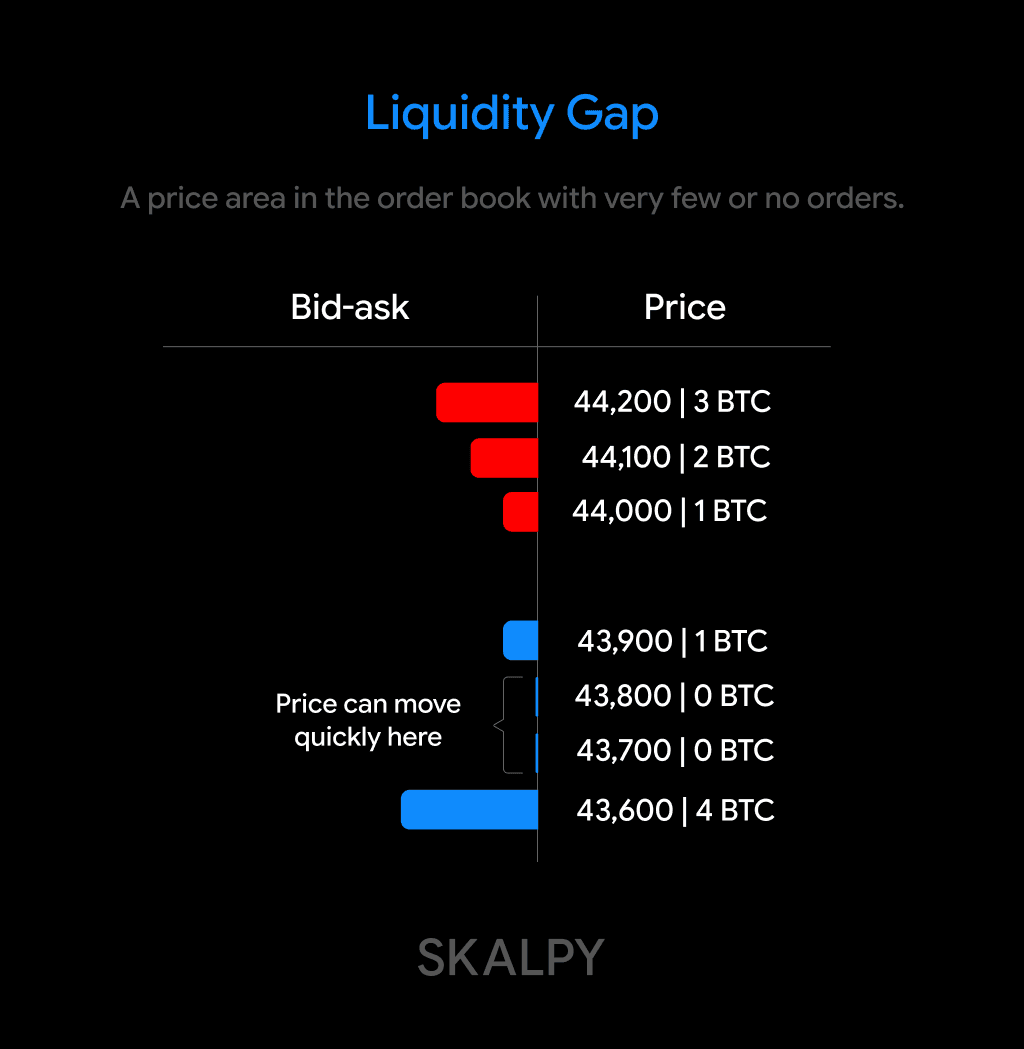
Liquidity Gaps
Sometimes you'll notice price levels with little or no volume. These gaps indicate areas where price can move quickly with minimal resistance. If the market pushes through a liquidity gap, expect rapid price movement until the next area of significant orders.
Order Flow
Watch how orders appear and disappear. Are large buy orders constantly being added on the bid side? This suggests accumulation. Are sell orders getting absorbed quickly? This indicates strong demand.
Quality trading platforms update the DOM in real-time, letting you see this order flow as it happens. This speed is crucial because market conditions change in seconds.
DOM Trading Strategies
Scalping with DOM
Scalpers use DOM to identify exact entry and exit points. They look for:
Large orders providing temporary support/resistance
Rapid order flow indicating momentum
Imbalances between bid and ask volume
Quick fills against large resting orders
For scalping, having a fast platform with clear DOM visualization matters enormously. You need ultra-low latency execution and the ability to read order flow instantly.
Identifying Absorption
Absorption happens when large orders at a price level keep getting filled but the order doesn't disappear or decrease much. This means someone is aggressively buying (or selling) into that level. It often precedes strong directional moves.
Example:
You see a 20 BTC sell order at $43,500. The market trades at that level, 5 BTC fills, but the order still shows 20 BTC. Someone is adding to the order as it fills, absorbing all buying pressure. This suggests strong resistance and potential price rejection.
Spoofing Detection
Watch for large orders that appear and disappear without being filled. If a big bid wall keeps moving down as price approaches, it's likely spoofing. Someone is creating artificial support/resistance to manipulate price without intending to execute.
Real orders tend to stay in place and get filled or partially filled. Fake orders disappear when tested.
Using DOM with Price Action
DOM works best when combined with chart analysis. Use the DOM to identify key levels, then watch how price action reacts when it reaches those levels.
Combined Strategy:
Chart shows price approaching a resistance level
DOM reveals a large ask wall at that exact price
Price reaches the level and starts to slow
DOM shows bid orders disappearing, ask volume increasing
You decide to take profits or enter a short position
DOM in Different Markets
Futures Trading
Futures markets pioneered DOM use. The centralized nature of futures exchanges means DOM shows the complete order book. Futures DOM typically displays contracts at each level and updates with extremely high frequency.
Stock Trading
Stock DOM is less complete because orders are spread across multiple exchanges and dark pools. Level 2 quotes show aggregated depth but not the full picture. Still, for liquid stocks, DOM provides valuable insight into supply and demand.
Cryptocurrency Trading
Crypto DOM varies by exchange. Each exchange maintains its own order book, so liquidity is fragmented. This makes it crucial to use platforms that provide clear visibility into the specific exchange you're trading on.
For crypto traders, DOM interfaces designed specifically for digital assets show order book depth with the clarity and speed needed for effective decision-making in this fast-moving market.
Common DOM Reading Mistakes
Overemphasizing Single Large Orders
One big order doesn't determine price direction. Look at the overall pattern of orders, not just individual walls. Context matters more than any single data point.
Ignoring Order Cancellations
Orders can be canceled instantly. That massive bid wall supporting price? It might vanish before price reaches it. Always have a backup plan.
Trading DOM Alone
DOM shows intentions, not commitments. Until an order executes, it's just information. Combine DOM analysis with price action, volume, and broader market context.
Assuming All Visible Orders Are Real
In crypto especially, not all orders represent genuine trading intent. Some are algorithmic, some are manipulative, and some will be canceled before execution.
Practical Tips for DOM Trading
Start with Liquid Markets
Practice DOM reading on highly liquid assets where order books are deep and price movements are clearer. Bitcoin and Ethereum are good starting points in crypto.
Use Visual Aids
Many modern platforms offer visual DOM displays with color-coded volume bars. These make it easier to spot walls and imbalances at a glance.
Focus on Nearby Levels
Orders 10% away from current price matter less than orders 0.5% away. Focus your attention on the 5-10 levels closest to the current market price.
Watch for Pattern Changes
DOM reading is about spotting changes. A suddenly appearing large order, rapid order cancellations, or a shift in bid-ask balance all signal potential price movement.
Practice Before Trading
Spend time watching DOM without trading. Learn how orders behave in different market conditions. Notice patterns before trying to trade based on them.
The Bottom Line
Depth of Market (DOM) gives you x-ray vision into market structure. While most traders react to price movements after they happen, DOM readers see the forces building before price moves. You see where large players are positioned, where liquidity exists, and where it doesn't.
However, DOM is a tool, not a crystal ball. It shows current intentions, which can change instantly. The key is combining DOM analysis with price action, volume, and market context to make informed trading decisions.
For serious traders, especially those scalping or day trading crypto, having access to a quality DOM interface is essential. Platforms like Skaply provide the real-time order book visualization and execution speed necessary to trade effectively using DOM data across multiple cryptocurrency exchanges.
Start by observing. Watch how price reacts when it reaches large orders. Notice how order book imbalances precede moves. Over time, DOM reading becomes intuitive, giving you an edge that chart-only traders simply don't have.
The market shows its hand in the order book. Learning to read it puts you steps ahead of the crowd.

Trading
Beating Analysis Paralysis: How to Survive Information Overload in Crypto Scalping
Overcome analysis paralysis in crypto trading. Learn how to filter market noise, streamline your workspace, and focus purely on order flow execution.

Scalping
Beyond PnL: Building a Professional Scalper's Trading Journal
Discover why a trading journal is the ultimate edge for crypto scalpers. Learn how to track market microstructure, analyze execution, and use professional data to eliminate systemic leaks.

Trading
Trading the Breakout: How to Filter False Breakouts Using Order Book Data
Improve your breakout strategy by understanding market microstructure. Learn how order flow, absorption, and DOM data can help filter false breakouts.

