

Introduction
The head and shoulders pattern ranks among the most recognizable and statistically reliable formations in technical analysis. Research analyzing over 400 instances found that 93% accurately predicted trend reversals, with price declines averaging 23% over approximately three months. For traders seeking systematic approaches to identifying market tops, mastering this pattern is essential.
Understanding the Formation
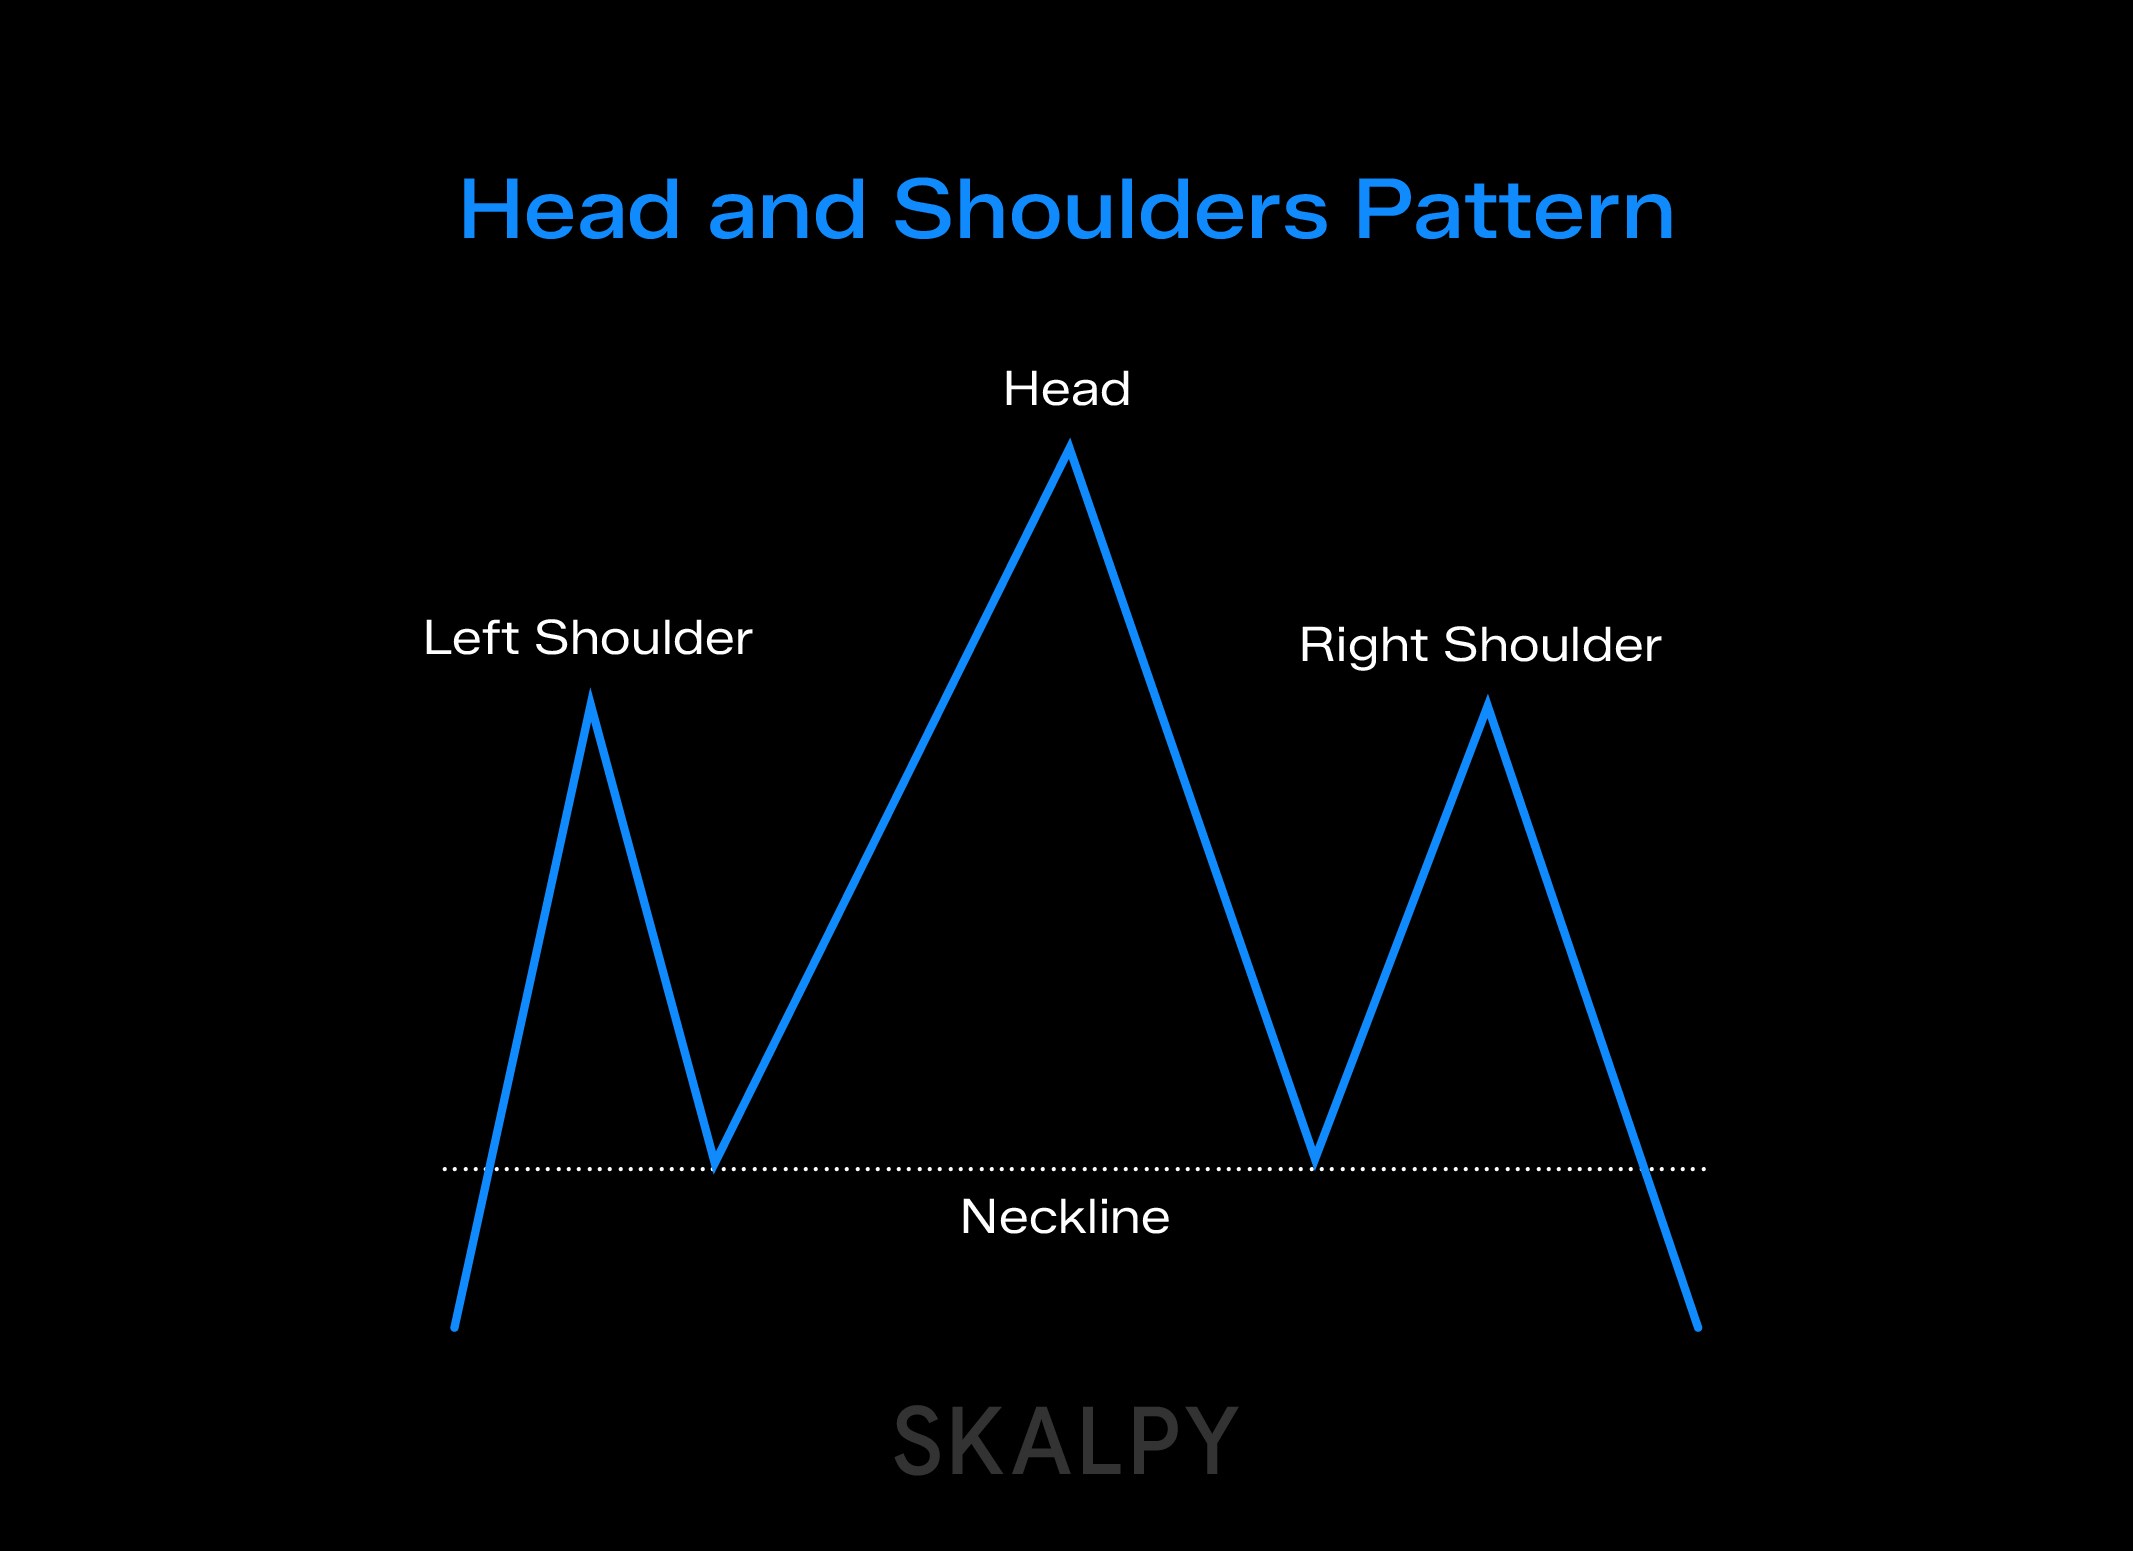
The head and shoulders consists of three peaks during an uptrend. The middle peak, the "head," rises highest, while the left and right peaks, the "shoulders," form at roughly equal lower levels. A line connecting the troughs between these peaks creates the "neckline," your critical trigger point for trade execution.
What the Pattern Tells You
The head and shoulders reveals deteriorating trend strength. During the left shoulder and head formation, buyers maintain dominance, pushing prices to new highs. However, by the right shoulder, momentum fades. The inability to reach a new high despite bullish efforts signals vulnerability.
When trading these setups, execution speed matters. Platforms like Skaply, a fast cross-platform crypto trading terminal, allow traders to monitor pattern development across multiple assets simultaneously and execute precise entries when the neckline breaks.
Step-by-Step Trading Strategy
Identifying Valid Patterns
Before committing capital, confirm the pattern meets these criteria: The head must clearly exceed both shoulders in height. The shoulders should form at approximately similar levels (perfect symmetry is rare but relative equality matters). The neckline should be clearly identifiable, connecting the troughs between formations.
Entry Execution
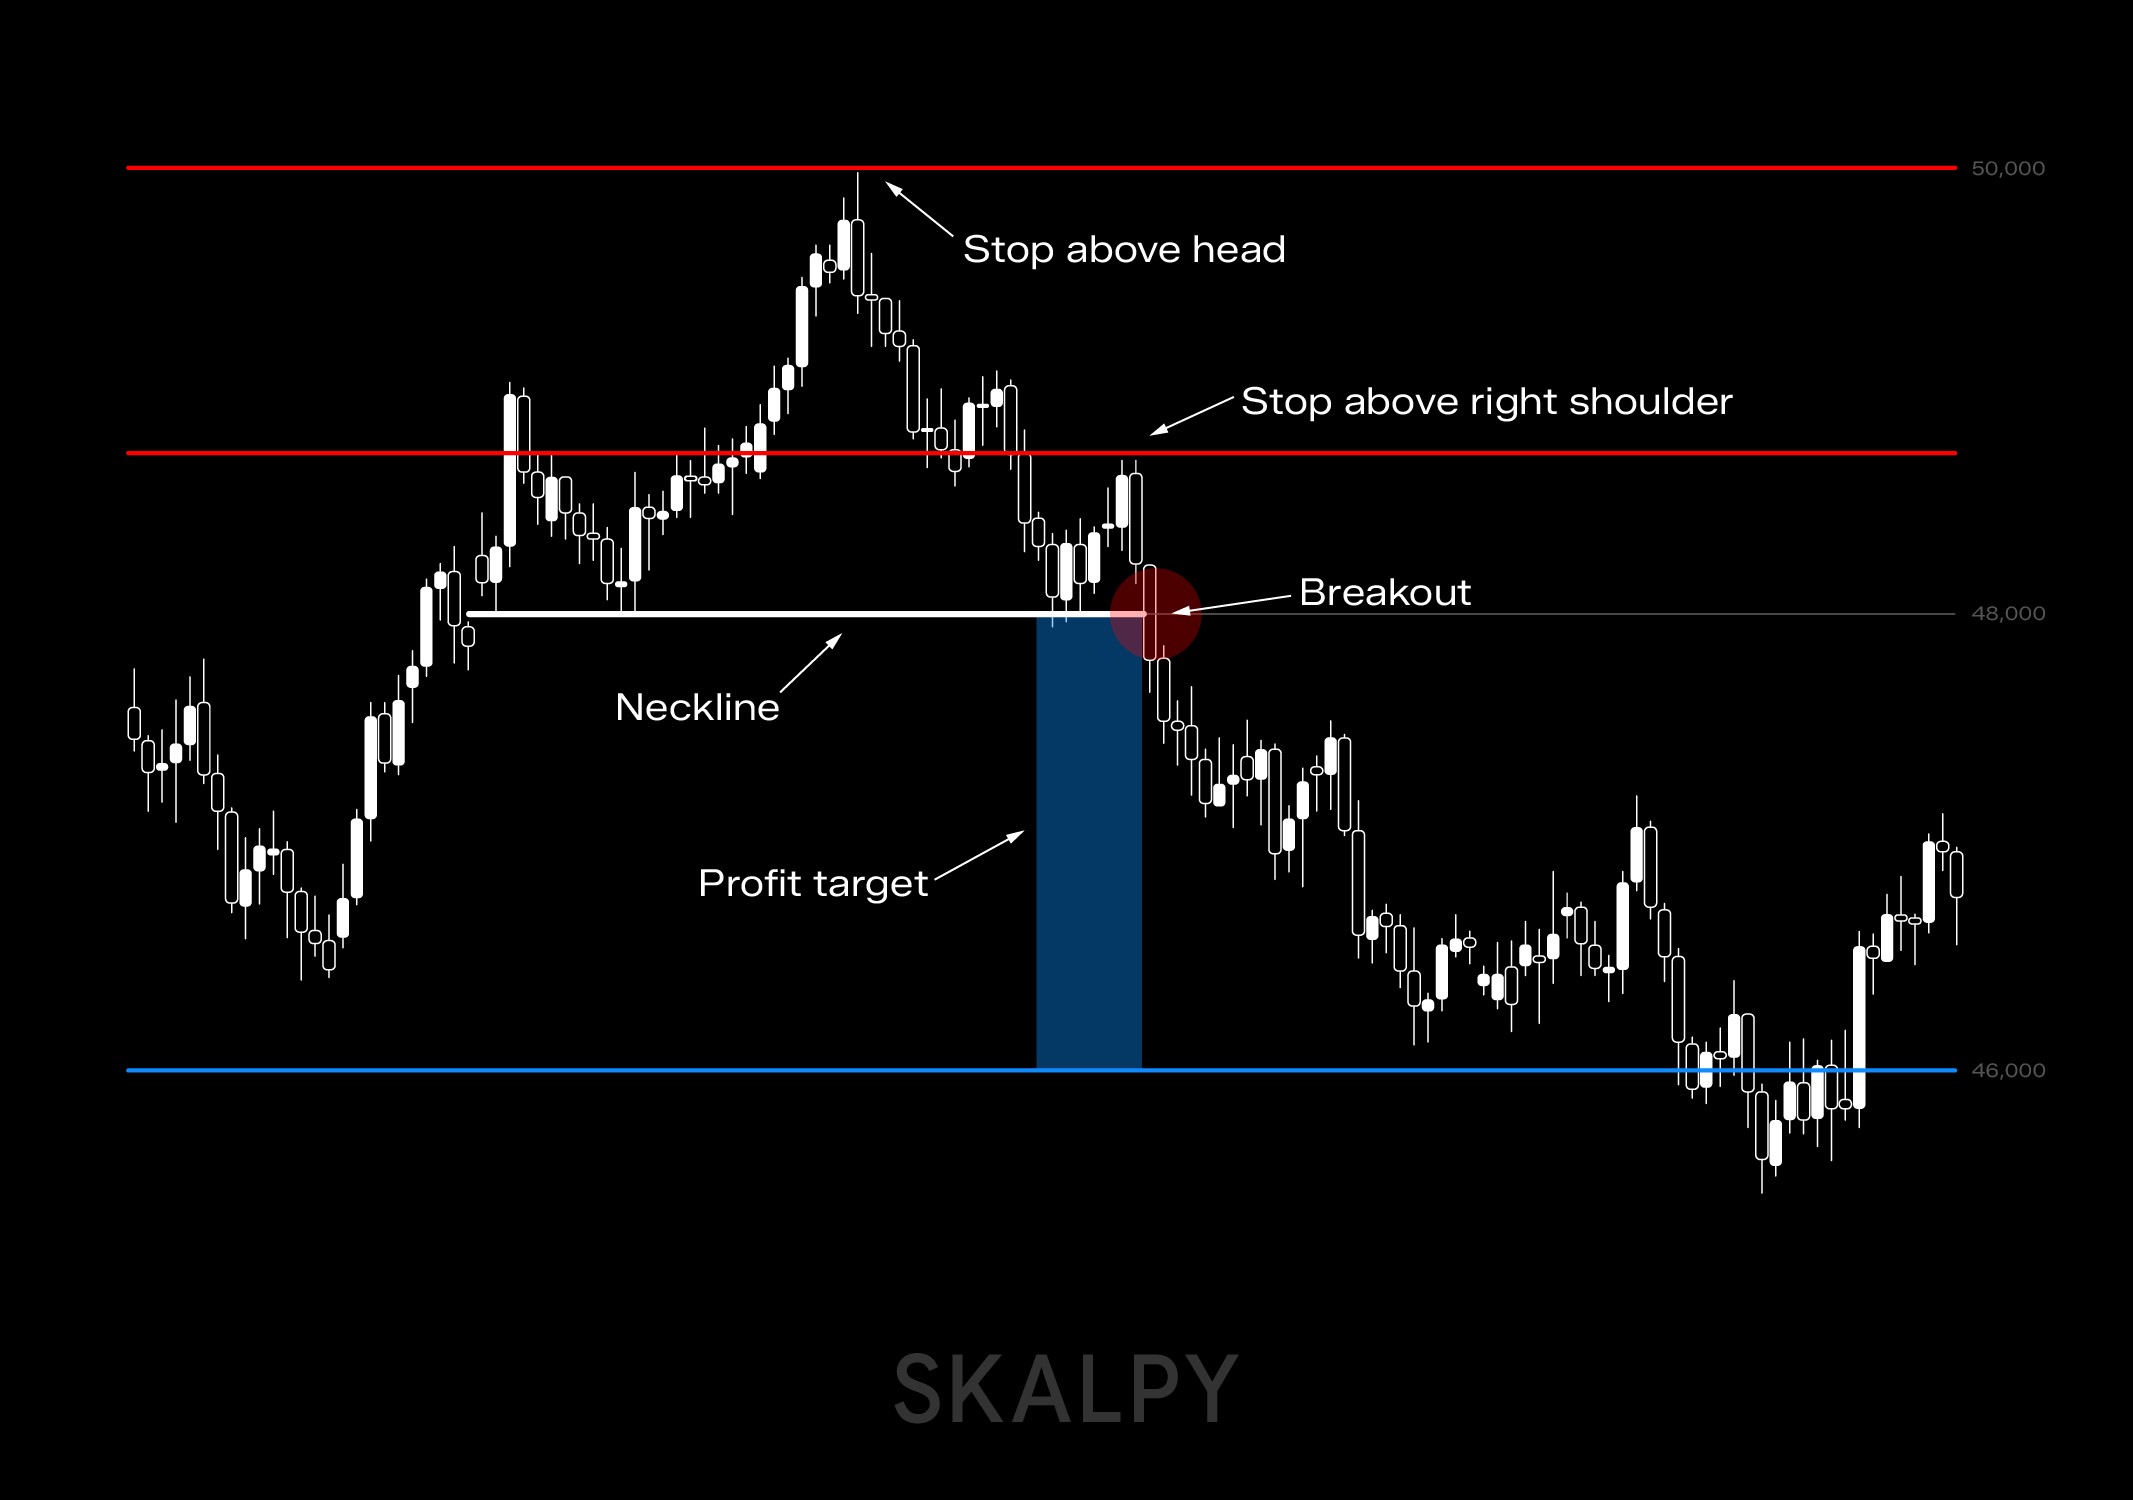
The textbook entry occurs when price decisively breaks below the neckline. Many traders wait for a candle close below this level to avoid false breakouts. Conservative traders prefer waiting for a retest, entering when price rallies back to test the neckline from below, confirming it has flipped from support to resistance.
Stop Loss Management
Place your protective stop above the right shoulder. This positioning protects against pattern failure while giving the trade sufficient room. If price reclaims the area above the right shoulder after breaking the neckline, the pattern has failed and the uptrend likely continues.
Profit Targets
Calculate your target by measuring the vertical distance from the head's peak to the neckline, then projecting that distance downward from the neckline breakdown point. For example, if the head peaks at $50,000 and the neckline sits at $48,000, your target becomes $46,000 (the $2,000 distance projected downward).
Confirming the Pattern with Volume
Volume provides critical validation. Ideally, volume increases during the formation of the left shoulder and head as buying reaches climax. Volume should then diminish during the right shoulder formation, indicating reduced buying interest. The neckline breakdown must occur on expanding volume to confirm sellers are committed. Weak volume on the breakdown suggests the move lacks conviction and may reverse.
Advanced Validation Techniques
Professional traders enhance pattern reliability by analyzing wave strength. The downward wave following the head should show increased selling pressure compared to earlier declines. If the pullback from the right shoulder displays weak volume and short duration, it confirms buyers are exhausted.
Additionally, monitor price behavior at the neckline. Multiple tests of this level with progressively weaker bounces indicate support is crumbling. When the final breakdown occurs, these failed defense attempts validate the bearish setup.
For active traders managing multiple positions, tools like Skaply provide the execution speed needed to capitalize on confirmed breakdowns before optimal entry zones disappear.
Common Mistakes to Avoid
Premature Entry: Many traders anticipate the pattern before completion, entering during right shoulder formation. Wait for confirmed neckline breakdown before acting.
Ignoring Context: A head and shoulders forming after a brief rally carries different implications than one appearing after a multi-year bull market. Consider broader trend context and timeframe alignment.
Perfect Pattern Obsession: Real markets rarely produce textbook formations. Shoulders may not align perfectly, necklines may slope. Focus on the underlying message (weakening momentum) rather than geometric perfection.
Volume Neglect: Patterns without volume confirmation have higher failure rates. Always verify the breakdown occurs on strong selling volume.
Practical Implementation
Use multiple timeframes to validate setups. A head and shoulders on a daily chart gains credibility when weekly trend analysis shows overall momentum weakening. Conversely, a pattern on a 15-minute chart contradicting a strong daily uptrend carries less weight.
Combine the pattern with other technical indicators. If the neckline breakdown coincides with breaking below a major moving average or key support level, the signal strengthens considerably. Momentum indicators showing bearish divergence during right shoulder formation add further confirmation.
Risk Management Essentials
Despite strong historical accuracy, never risk excessive capital on any single setup. Calculate your risk-reward ratio before entering. If your stop loss requires $1,000 risk while your target offers $2,500 potential profit, you have favorable 1:2.5 risk-reward justifying the trade.
Position size appropriately. Even high-probability setups fail occasionally. Protect your capital by risking only 1-2% per trade, ensuring a series of losses won't significantly damage your account.
The Inverse Head and Shoulders
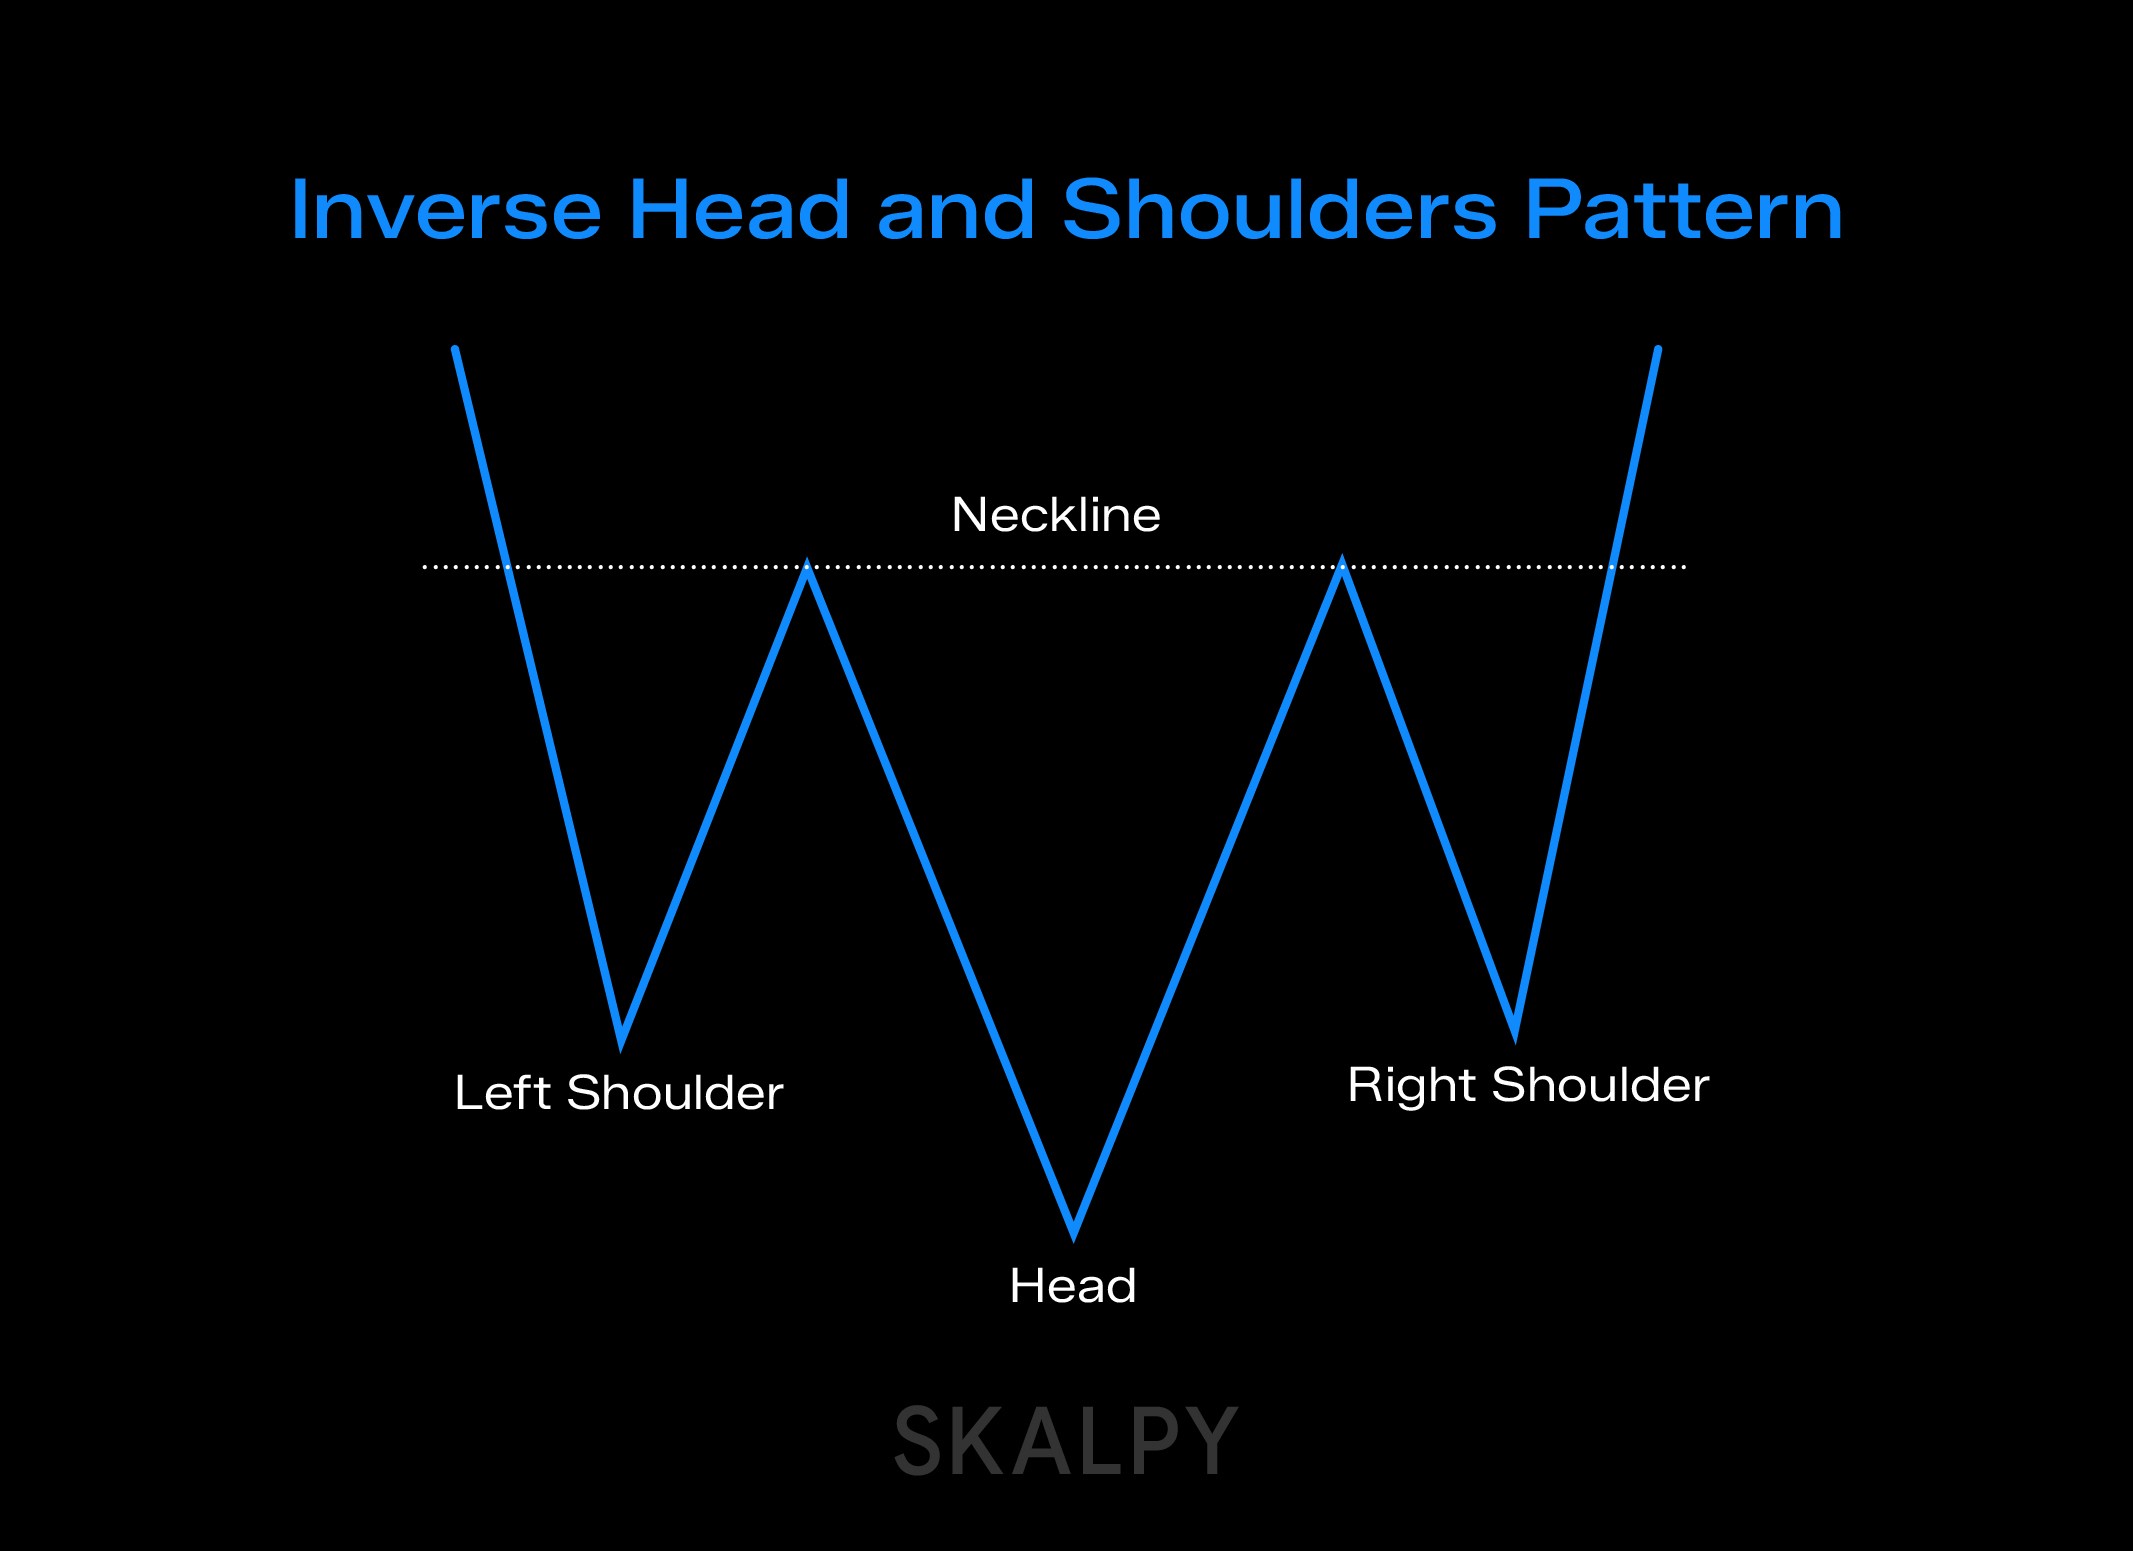
The pattern works equally well in reverse for identifying market bottoms. An inverted head and shoulders forms three troughs during a downtrend, with the middle trough (head) lowest. Trading logic mirrors the standard pattern: enter on neckline breakout to the upside, place stops below the right shoulder, and project targets upward.
Enhancing Pattern Analysis
Consider using range charts or non-time-based chart types. These can make pattern recognition easier by filtering market noise and highlighting genuine structural shifts. Volume profile analysis shows you where significant trading occurred during pattern formation, helping identify key levels likely to influence future price action.
Final Considerations
The head and shoulders pattern offers traders a systematic framework for identifying trend exhaustion and reversals. Its combination of visual clarity, defined entry and exit points, and statistical backing makes it valuable across all markets and timeframes.
Success requires patience to wait for complete pattern formation and discipline to follow your trading plan. Combined with proper risk management and quick execution through reliable platforms, the head and shoulders becomes a powerful tool for capturing trend reversals as they begin.
Whether you're actively scalping or building swing positions, understanding this classic pattern and its implications for market structure sharpens your ability to identify high-probability opportunities when bullish trends exhaust and bears seize control.


