Technical Analysis
Divergence Trading: A Practical Guide to Spotting Market Reversals
Jan 28, 2026
written by:


Predicting when a market will change direction is one of the hardest challenges for traders. While most trading wisdom says "buy low, sell high," the reality is far more complex. That's where divergence trading becomes valuable. It helps identify potential reversals before they fully develop, giving traders an edge in timing their entries and exits.
What Divergence Actually Means
Divergence occurs when price action and momentum indicators tell different stories. Imagine the market is climbing to new peaks, but your technical indicator shows weakening strength with each advance. This disconnect signals that the current trend may be running out of steam.
The concept is straightforward: in healthy trends, price and momentum should move together. When Bitcoin surges to higher highs, indicators like RSI or MACD should follow suit. When they don't, experienced traders take notice.
For traders looking to act on these signals efficiently, platforms like Skaply, one of the fastest cross-platform trading terminals for crypto, make it easier to monitor multiple crypto pairs simultaneously and execute trades when opportunities emerge.
The Two Main Types: Regular vs. Hidden
Regular Divergence: Spotting Reversals
Regular divergence helps identify when a trend is about to flip. There are two varieties:
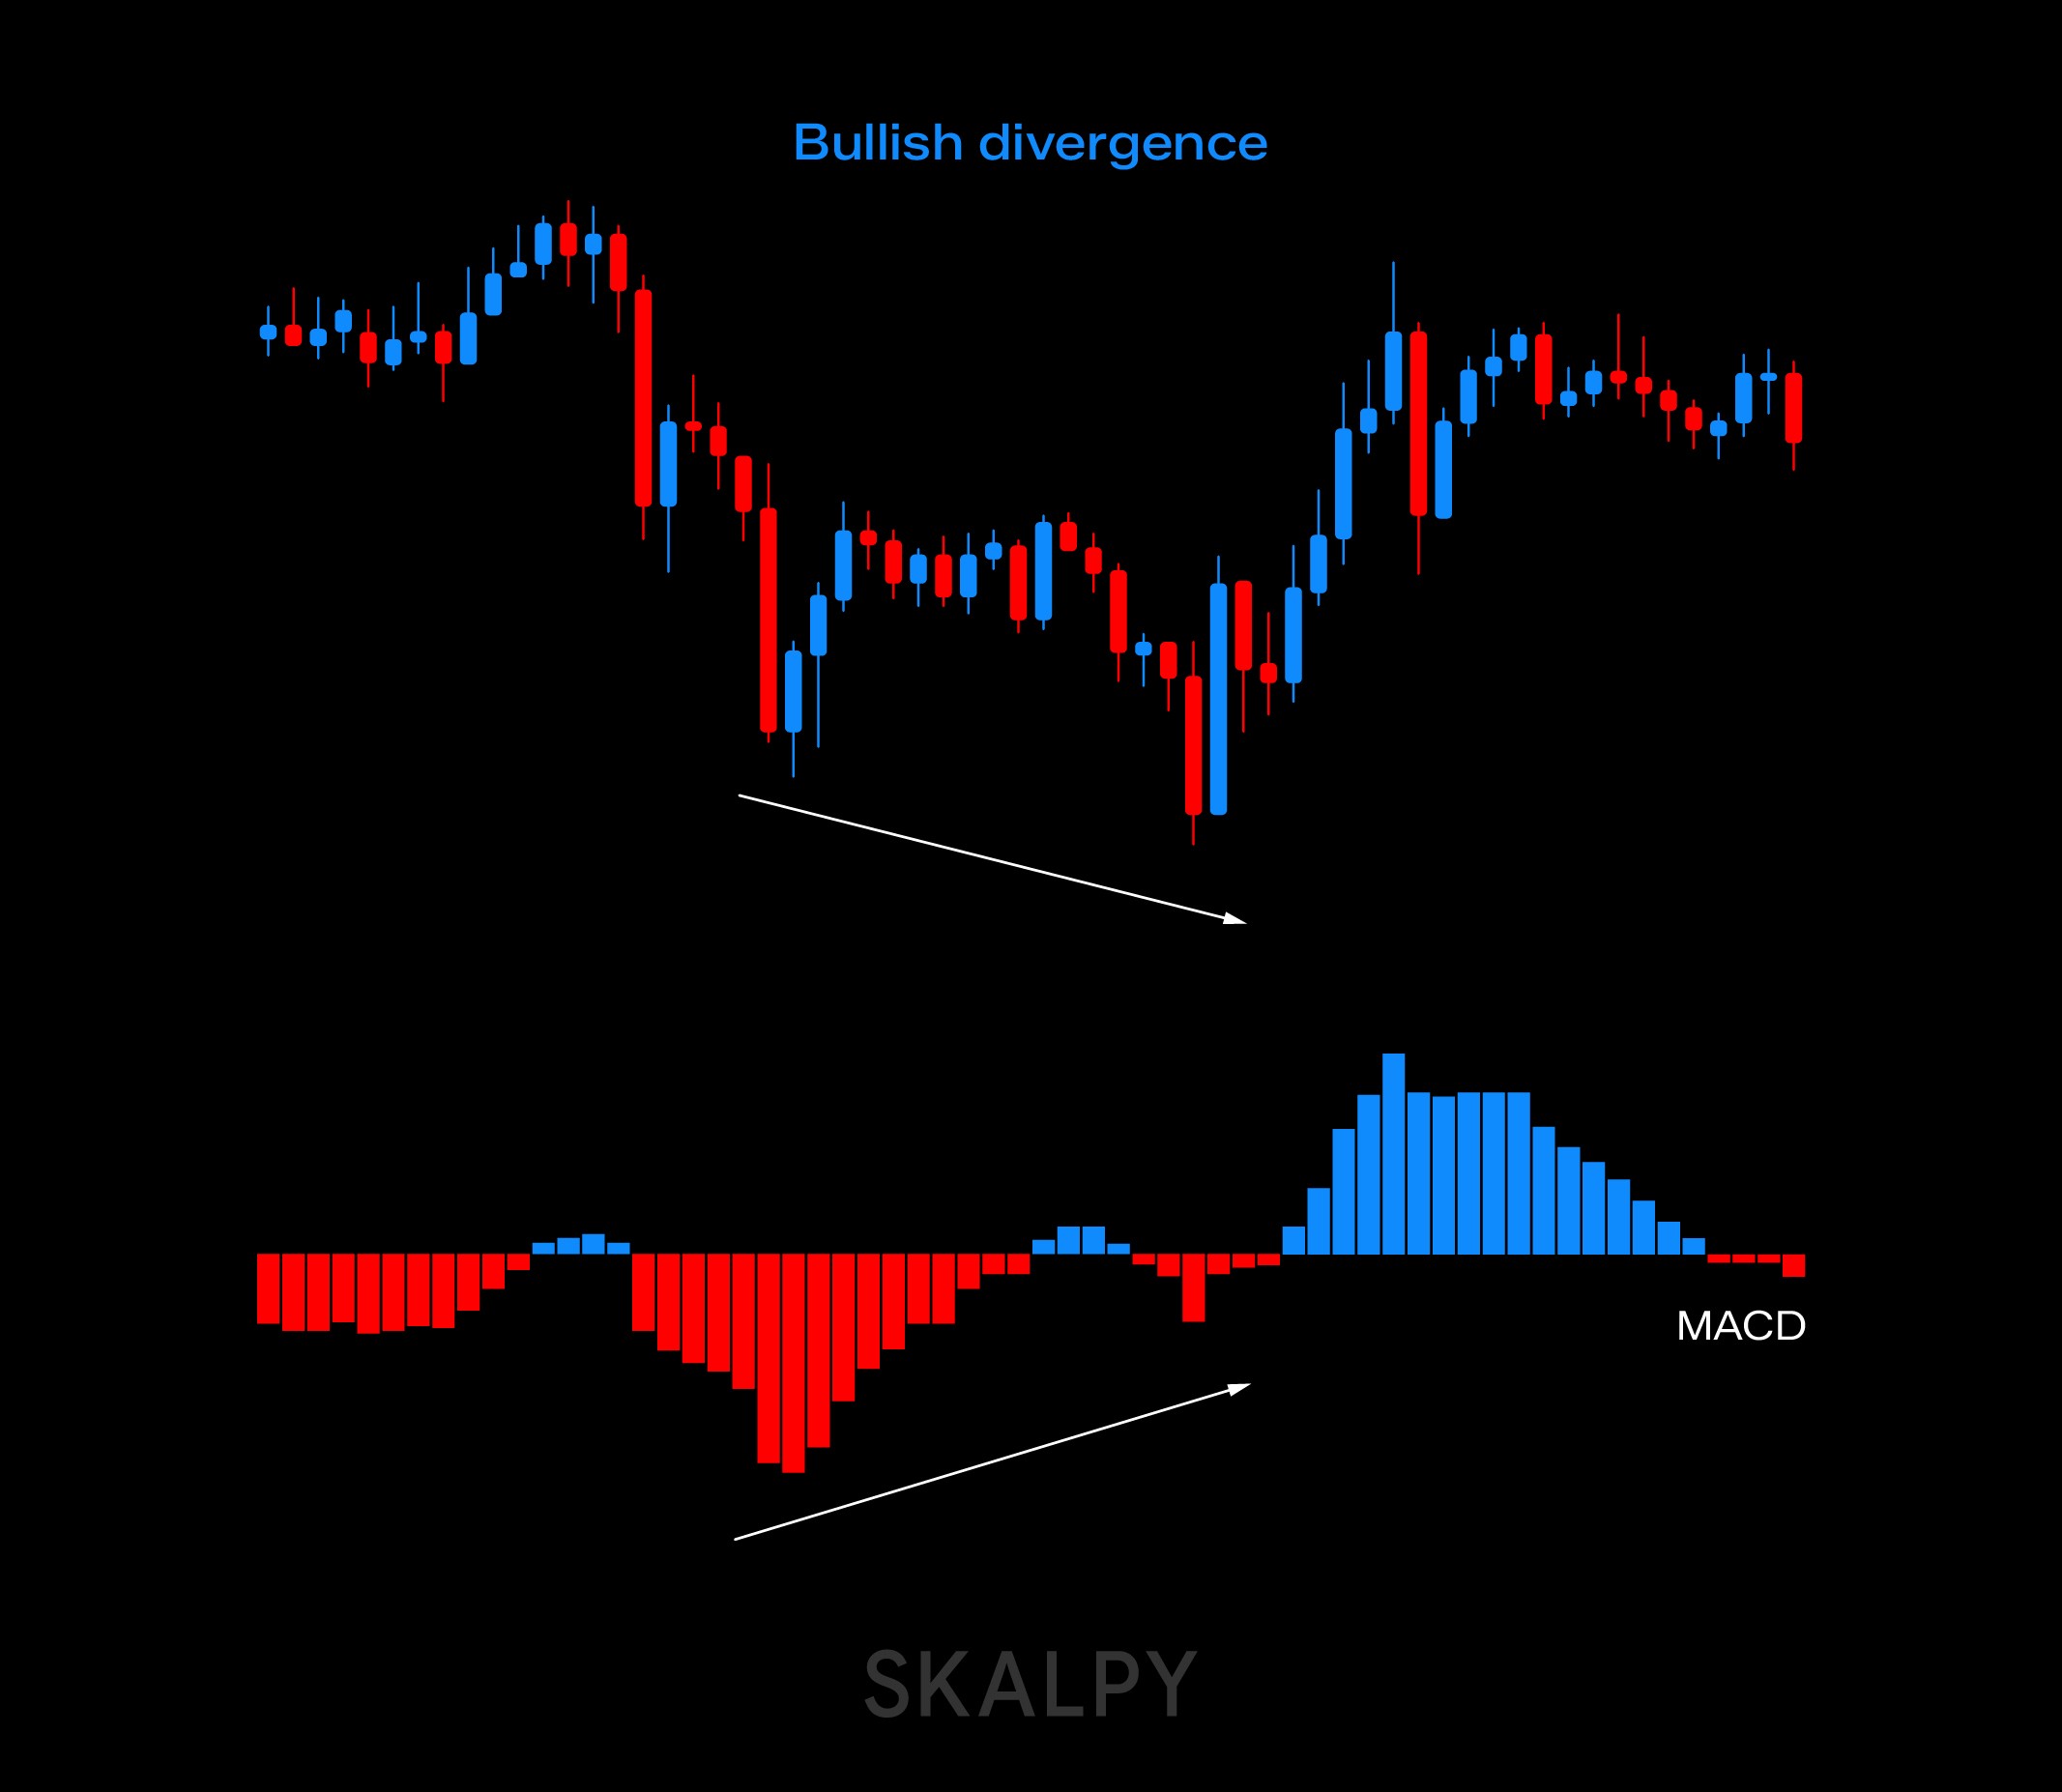
Bullish divergence appears during downtrends. The price keeps dropping to lower lows, but your oscillator forms higher lows. This suggests sellers are losing control, and a bounce may be coming. Think of it as the market saying, "I'm making new lows, but my heart isn't in it anymore."
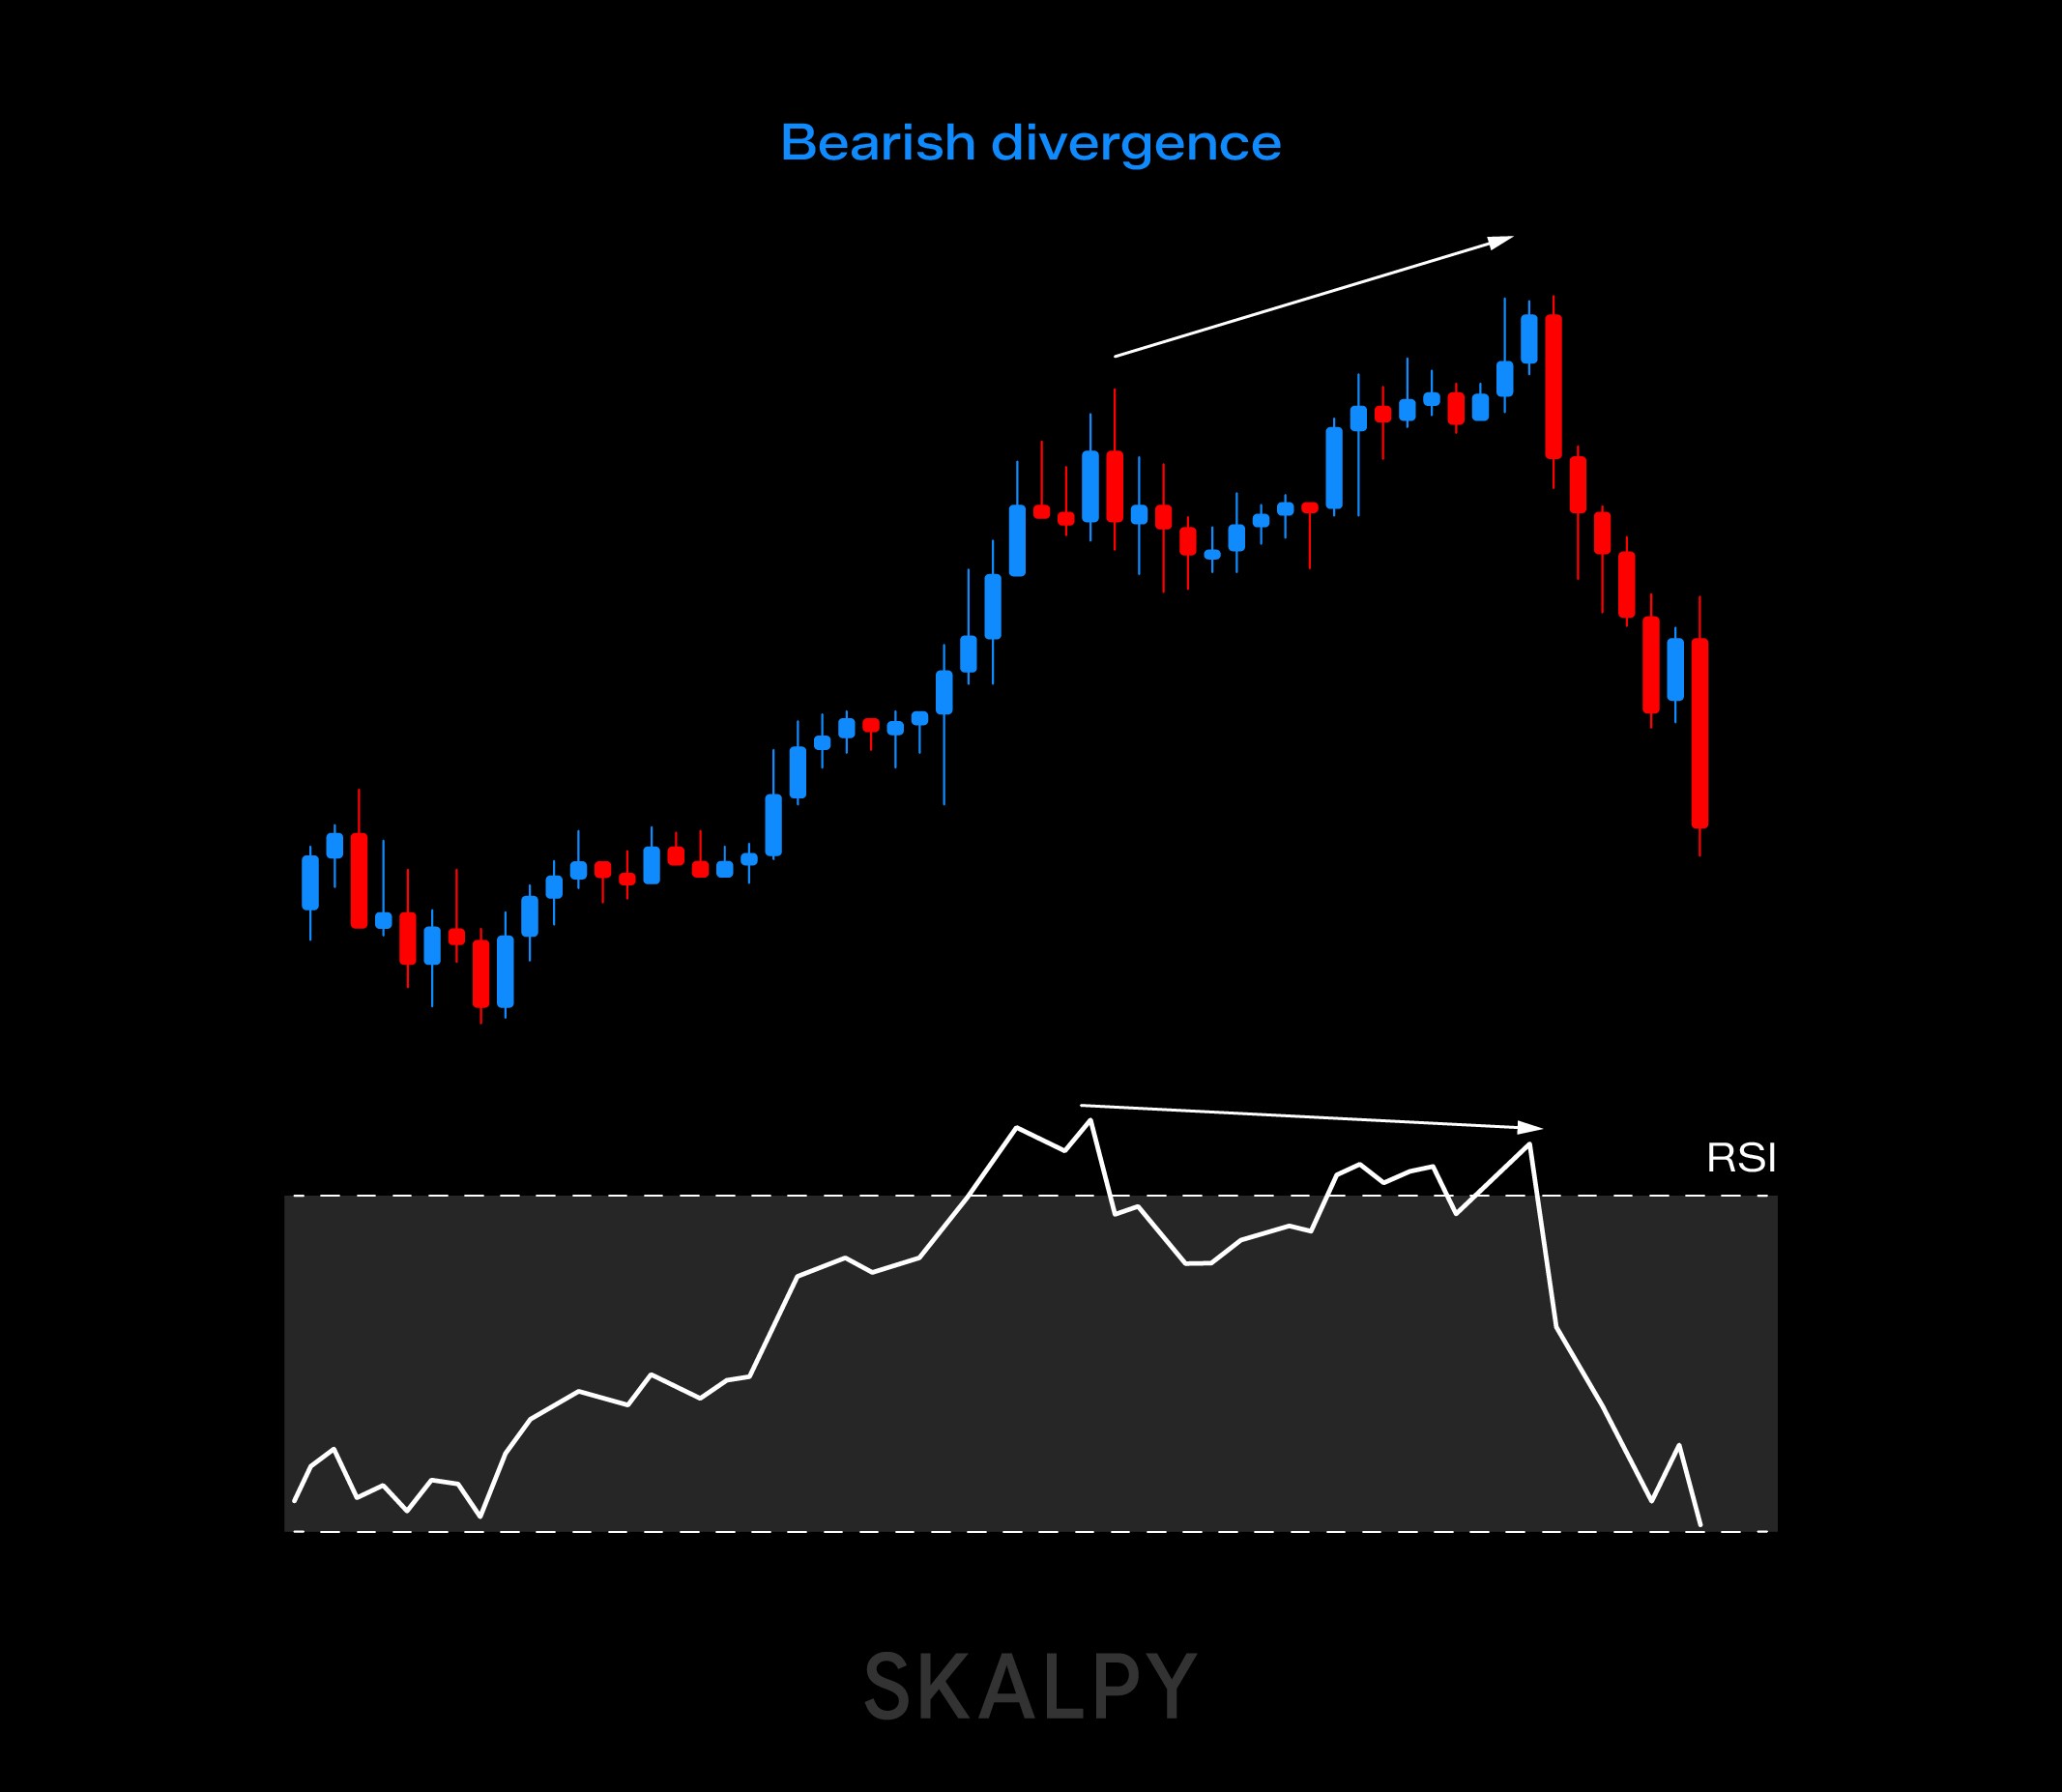
Bearish divergence is the opposite. During an uptrend, price reaches new highs, but the indicator shows lower highs. The momentum behind the rally is fading, often preceding a pullback or reversal.
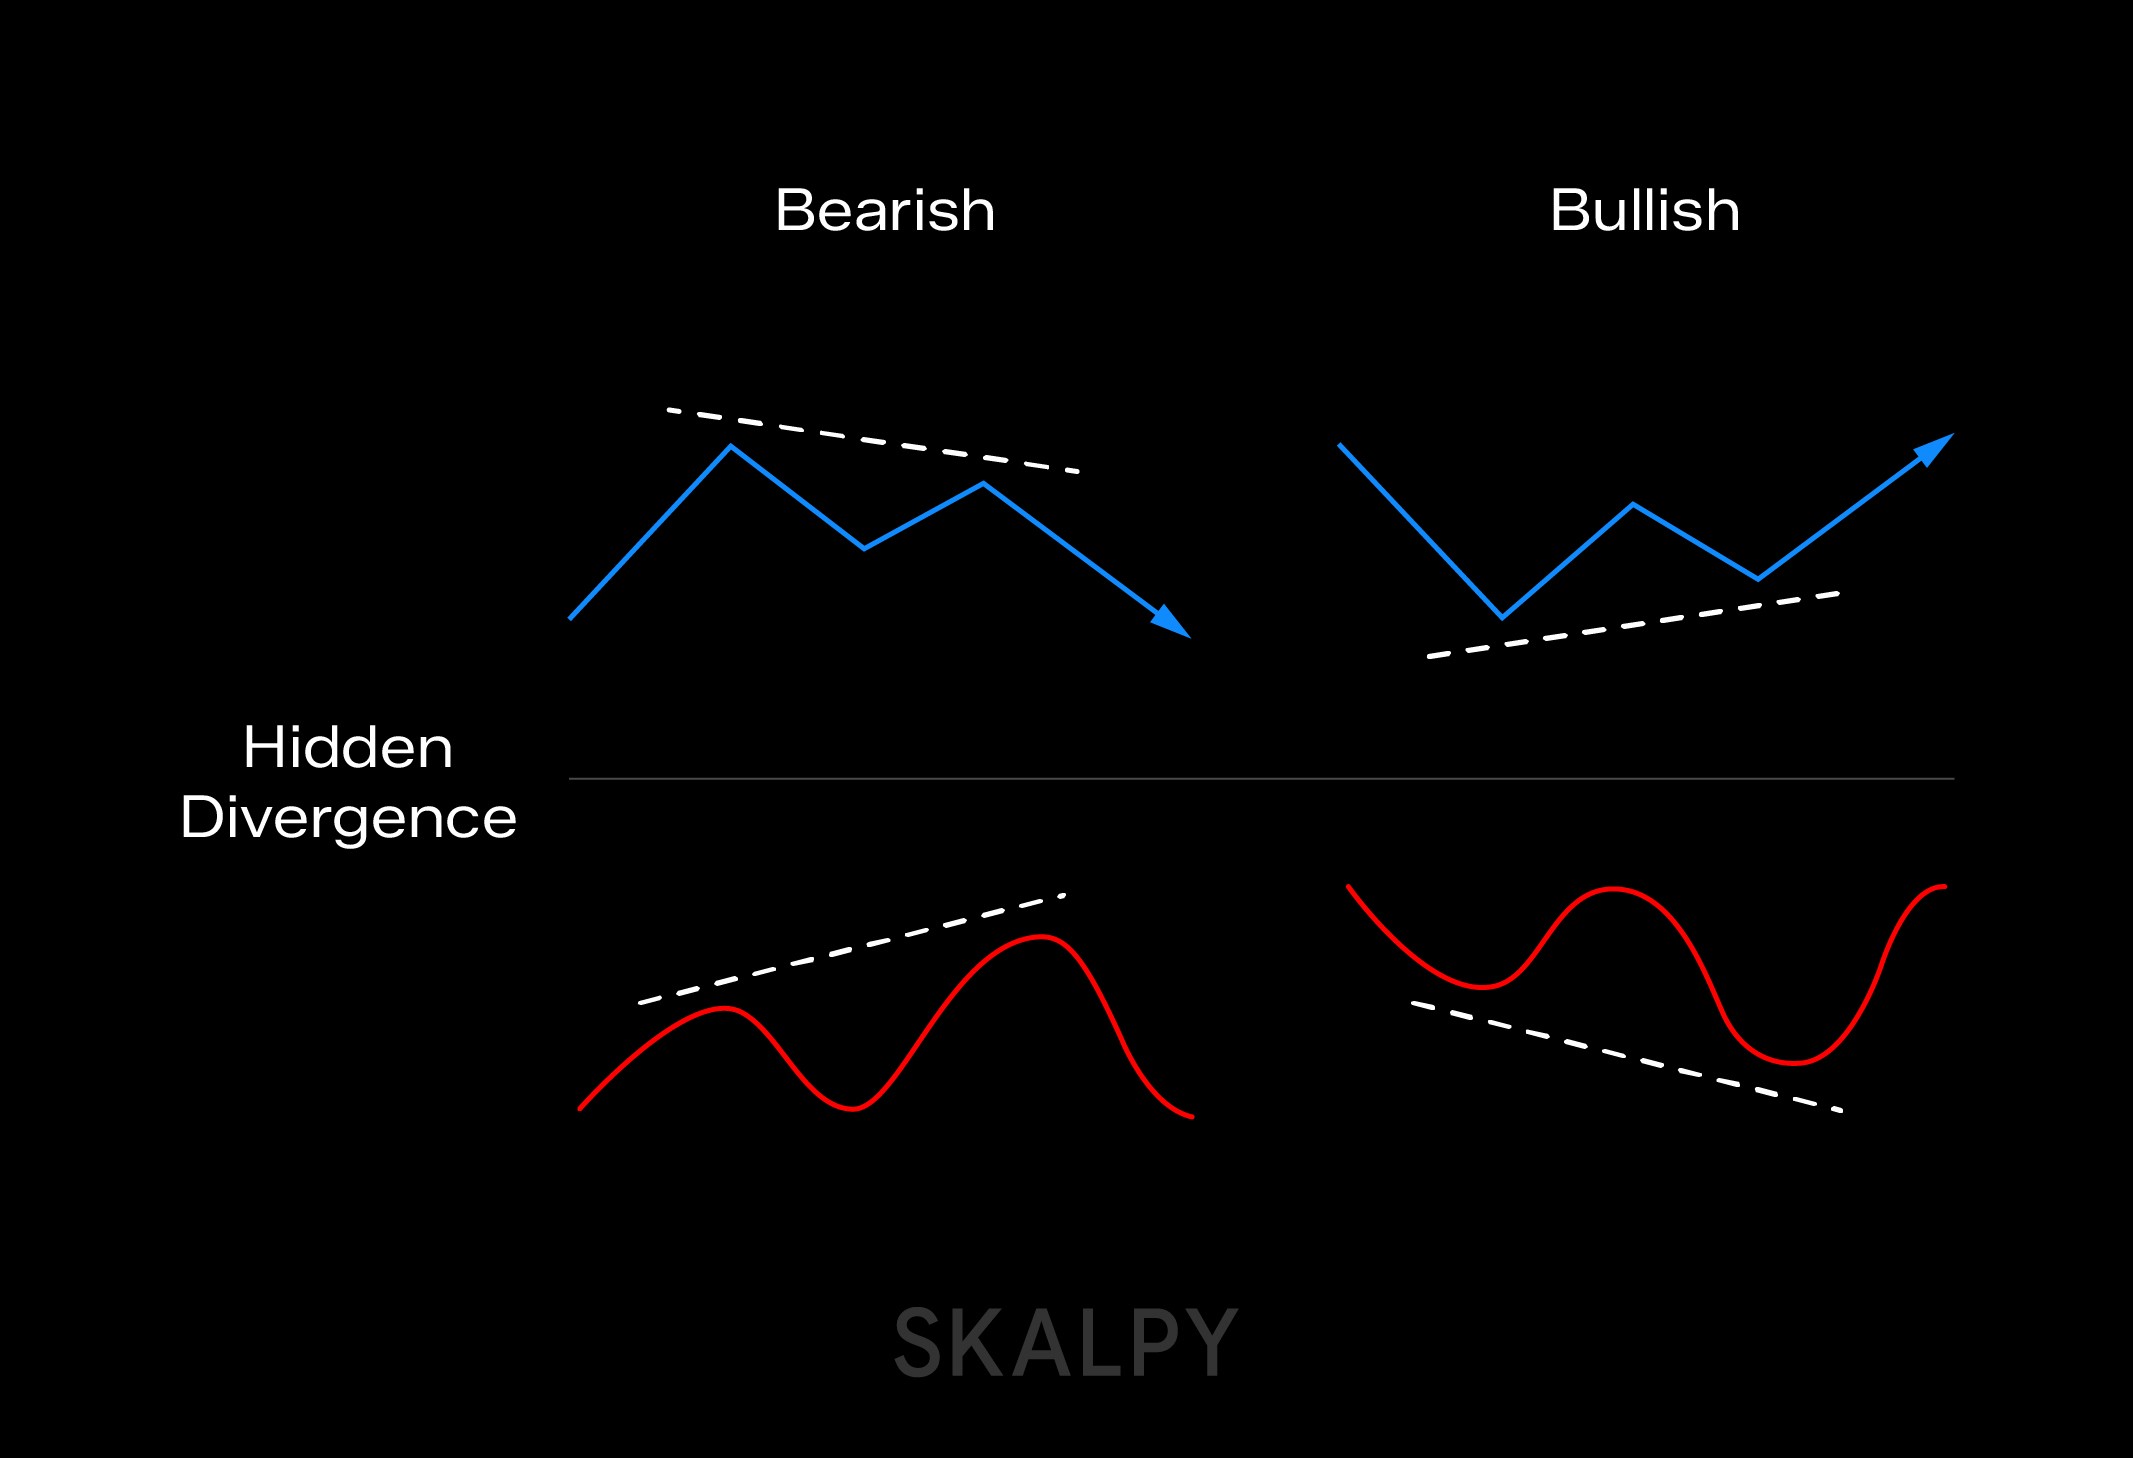
Hidden Divergence: Confirming Continuation
While regular divergence signals reversals, hidden divergence suggests the existing trend will continue after a temporary pause. This makes it particularly useful for trend traders.
Hidden bullish divergence occurs in uptrends. Price makes a higher low (still respecting the uptrend), but the indicator makes a lower low. This often means the pullback is just a breather before the uptrend resumes.
Hidden bearish divergence happens in downtrends. Price creates a lower high, maintaining the downtrend, while the indicator forms a higher high. The downtrend is likely to continue.
Best Indicators for Spotting Divergence
Three oscillators stand out for divergence analysis:
RSI (Relative Strength Index) measures momentum on a scale of 0 to 100. It's particularly effective for identifying overbought and oversold conditions alongside divergence patterns.
MACD (Moving Average Convergence Divergence) combines two moving averages with a histogram. Divergences in the histogram often provide earlier signals than other tools.
Stochastic Oscillator compares current prices to recent ranges. It's especially sensitive in volatile markets, catching divergences quickly.
Why Divergence Isn't Perfect
Despite its usefulness, divergence trading has limitations that every trader should understand:
False signals are common. Not every divergence leads to a reversal. Strong trends can produce multiple divergences while continuing in the original direction for extended periods.
Timing is uncertain. Divergence tells you momentum is shifting, but not exactly when the price will follow. You might be right about the reversal but too early, forcing you to hold through uncomfortable drawdowns.
Interpretation varies. Identifying peaks and troughs on indicators involves some subjectivity. What one trader sees as significant divergence, another might dismiss as noise.
Strong trends can override signals. In powerful bull or bear markets, divergences may appear repeatedly while the trend marches on. This is why waiting for the market to "slow down" after a strong move improves your odds.
Practical Trading Strategies
Smart divergence traders don't act on signals in isolation. Here's how to improve your approach:
Wait for confirmation. After spotting divergence, look for additional evidence: a trendline break, a candlestick reversal pattern, or a shift in market structure. This filters out many false signals.
Use proper risk management. Always place stop-loss orders. If you're shorting based on bearish divergence, put your stop just above the recent high. If the divergence fails, you're protected.
Consider market context. Divergence works best after extended moves when the market looks exhausted. In choppy, sideways markets, divergences produce more noise than insight.
Combine with price action. Watch how price responds to support and resistance levels after divergence appears. A divergence plus a rejection at a key level is more reliable than divergence alone.
The Bottom Line
Divergence trading offers a leading indicator approach that can help you anticipate trend changes before they're obvious. By comparing price action with momentum oscillators, you gain insight into the underlying strength of market moves.
However, like every trading tool, divergence works best as part of a complete strategy. Combine it with proper risk management, wait for confirmations, and stay aware of the broader market context. Whether you're catching reversals with regular divergence or riding trends with hidden divergence, the key is patience and discipline.
For active crypto traders who need fast execution and real-time technical analysis, using a responsive trading terminal makes all the difference. Skaply provides the tools and speed necessary to act on divergence signals effectively across multiple cryptocurrency markets.
Remember: divergence doesn't guarantee profits, but it does give you valuable information about momentum shifts. Used wisely, it's a powerful addition to your trading toolkit.


