

Introduction
Technical analysis has transformed into a fundamental requirement for today's traders, regardless of whether they handle conventional stocks or digital currencies like Bitcoin and Ethereum. From the vast array of technical indicators currently available, moving averages have earned recognition as particularly dependable and extensively used. Their goal is straightforward: assist traders in eliminating market clutter and identifying potential trends through historical price records.
What Are Moving Averages?
Moving averages work by evening out price variations on trading charts, which simplifies the process of recognizing underlying trends. Consider them a mechanism to observe the broader picture rather than becoming distracted by each minor price fluctuation. Although they fall into the "lagging indicators" category (meaning they utilize historical data instead of forecasting future shifts), they continue to be incredibly useful for grasping potential market direction.
For traders who value speed and efficiency in execution, platforms such as Skaply, a rapid cross-platform trading terminal designed specifically for scalping and dynamic trading, provide the infrastructure needed for quick order placement and market monitoring.
Two Main Categories: SMA vs. EMA
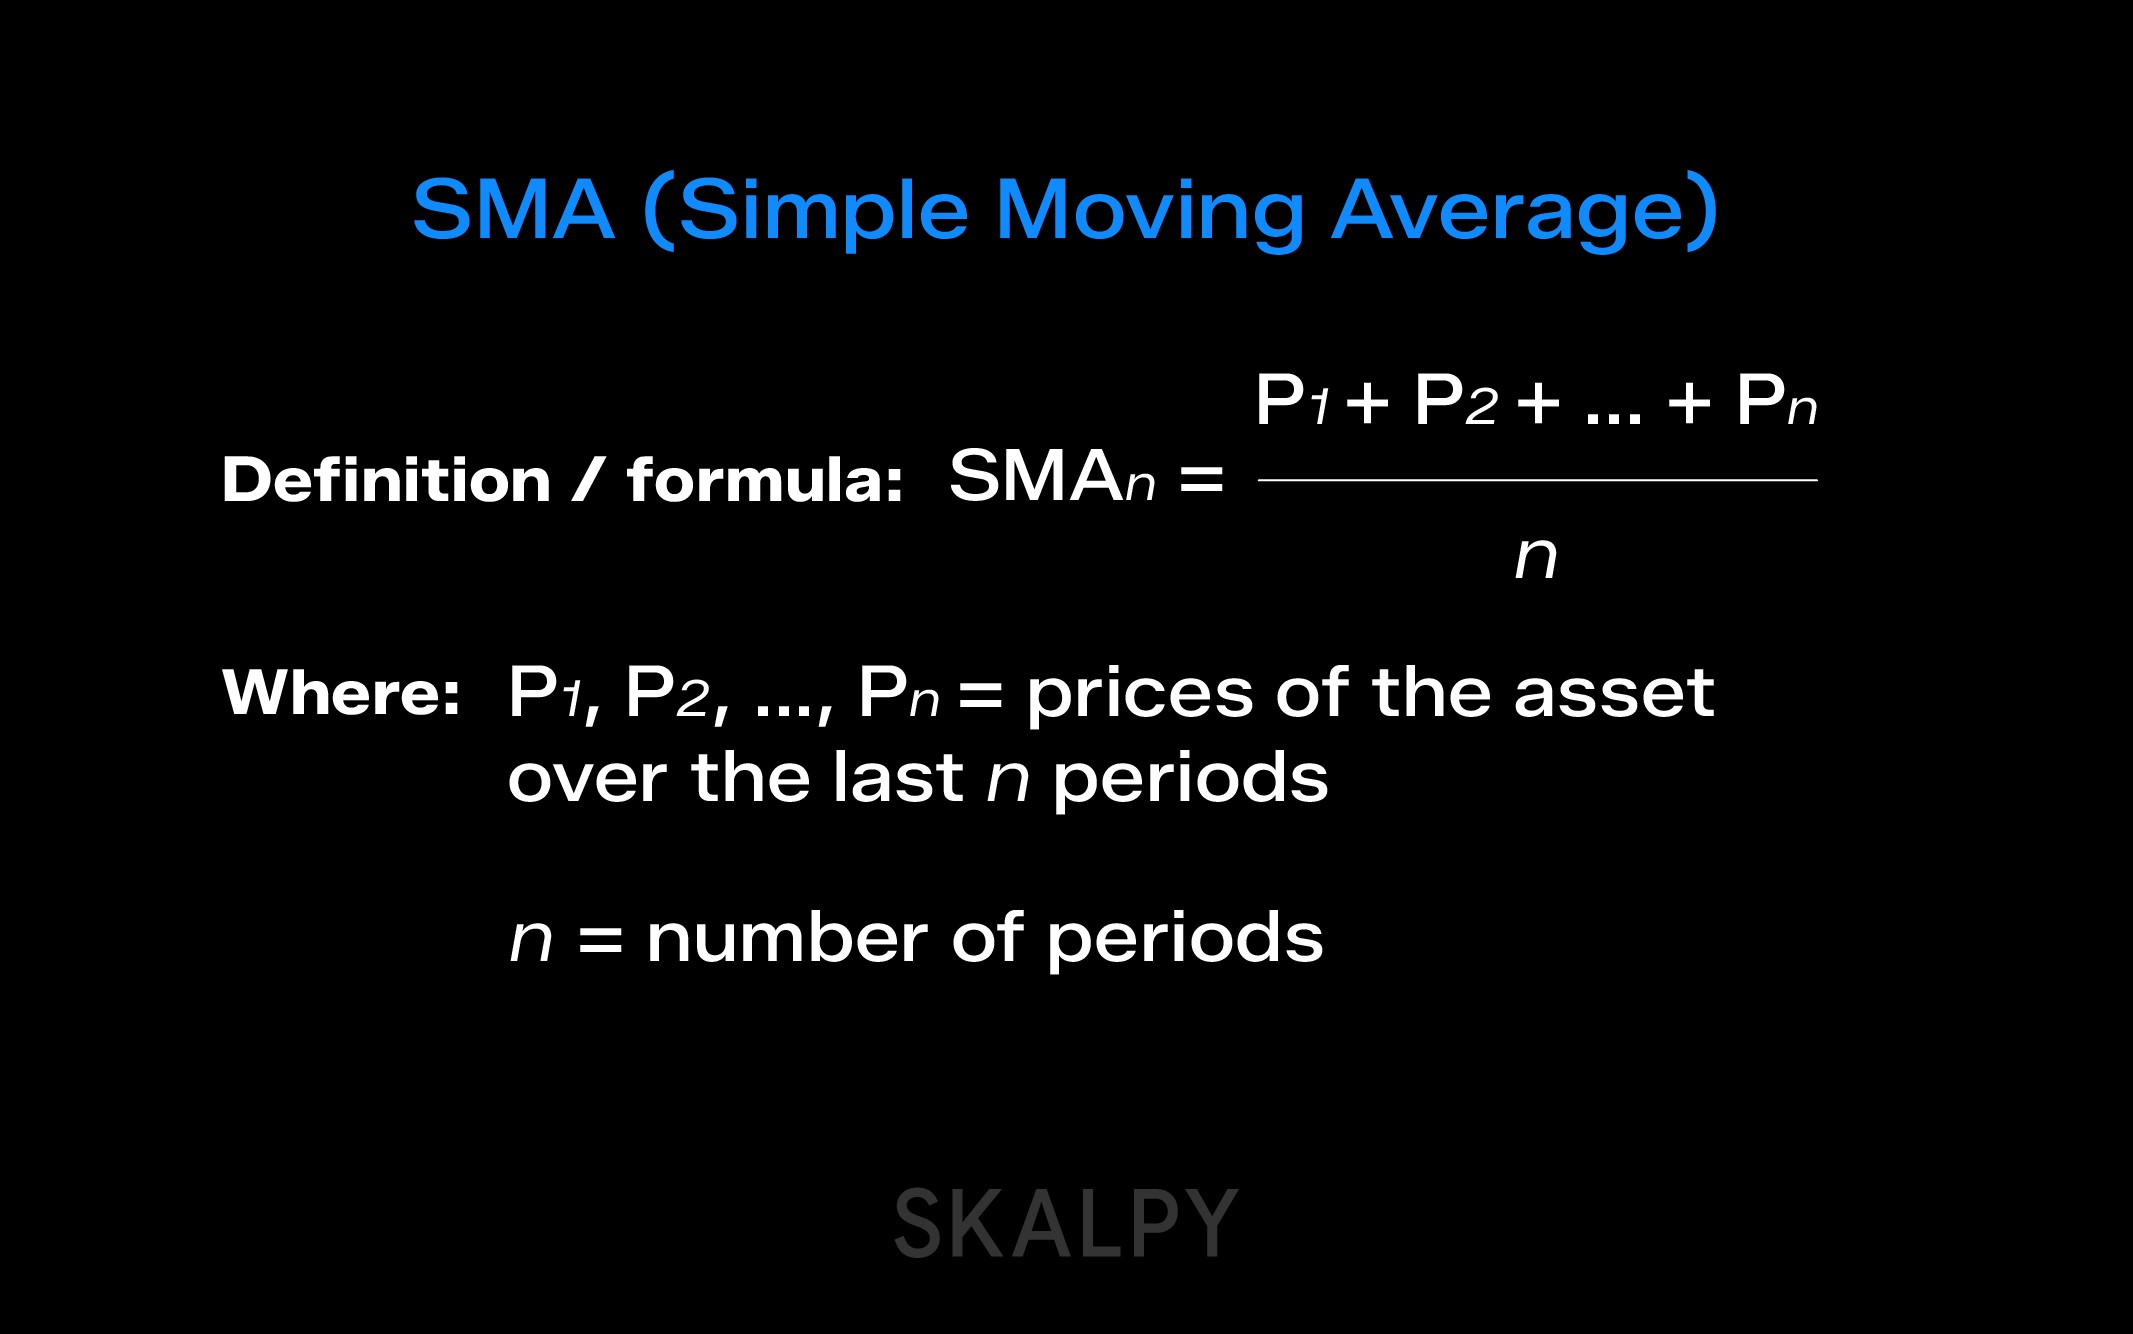
Simple Moving Average (SMA)
The simple moving average computes the arithmetic mean of prices throughout a designated time period. Here's the mechanism: as new price information becomes available, the most dated data point gets eliminated. When you monitor a 10-day SMA, the computation perpetually refreshes to incorporate exclusively the latest 10 days.
What characterizes SMAs is uniform weighting. Each data point carries identical importance, regardless of whether it originates from today or nine days prior. Certain traders perceive this as a limitation, arguing that current price movement warrants greater emphasis than historical records.
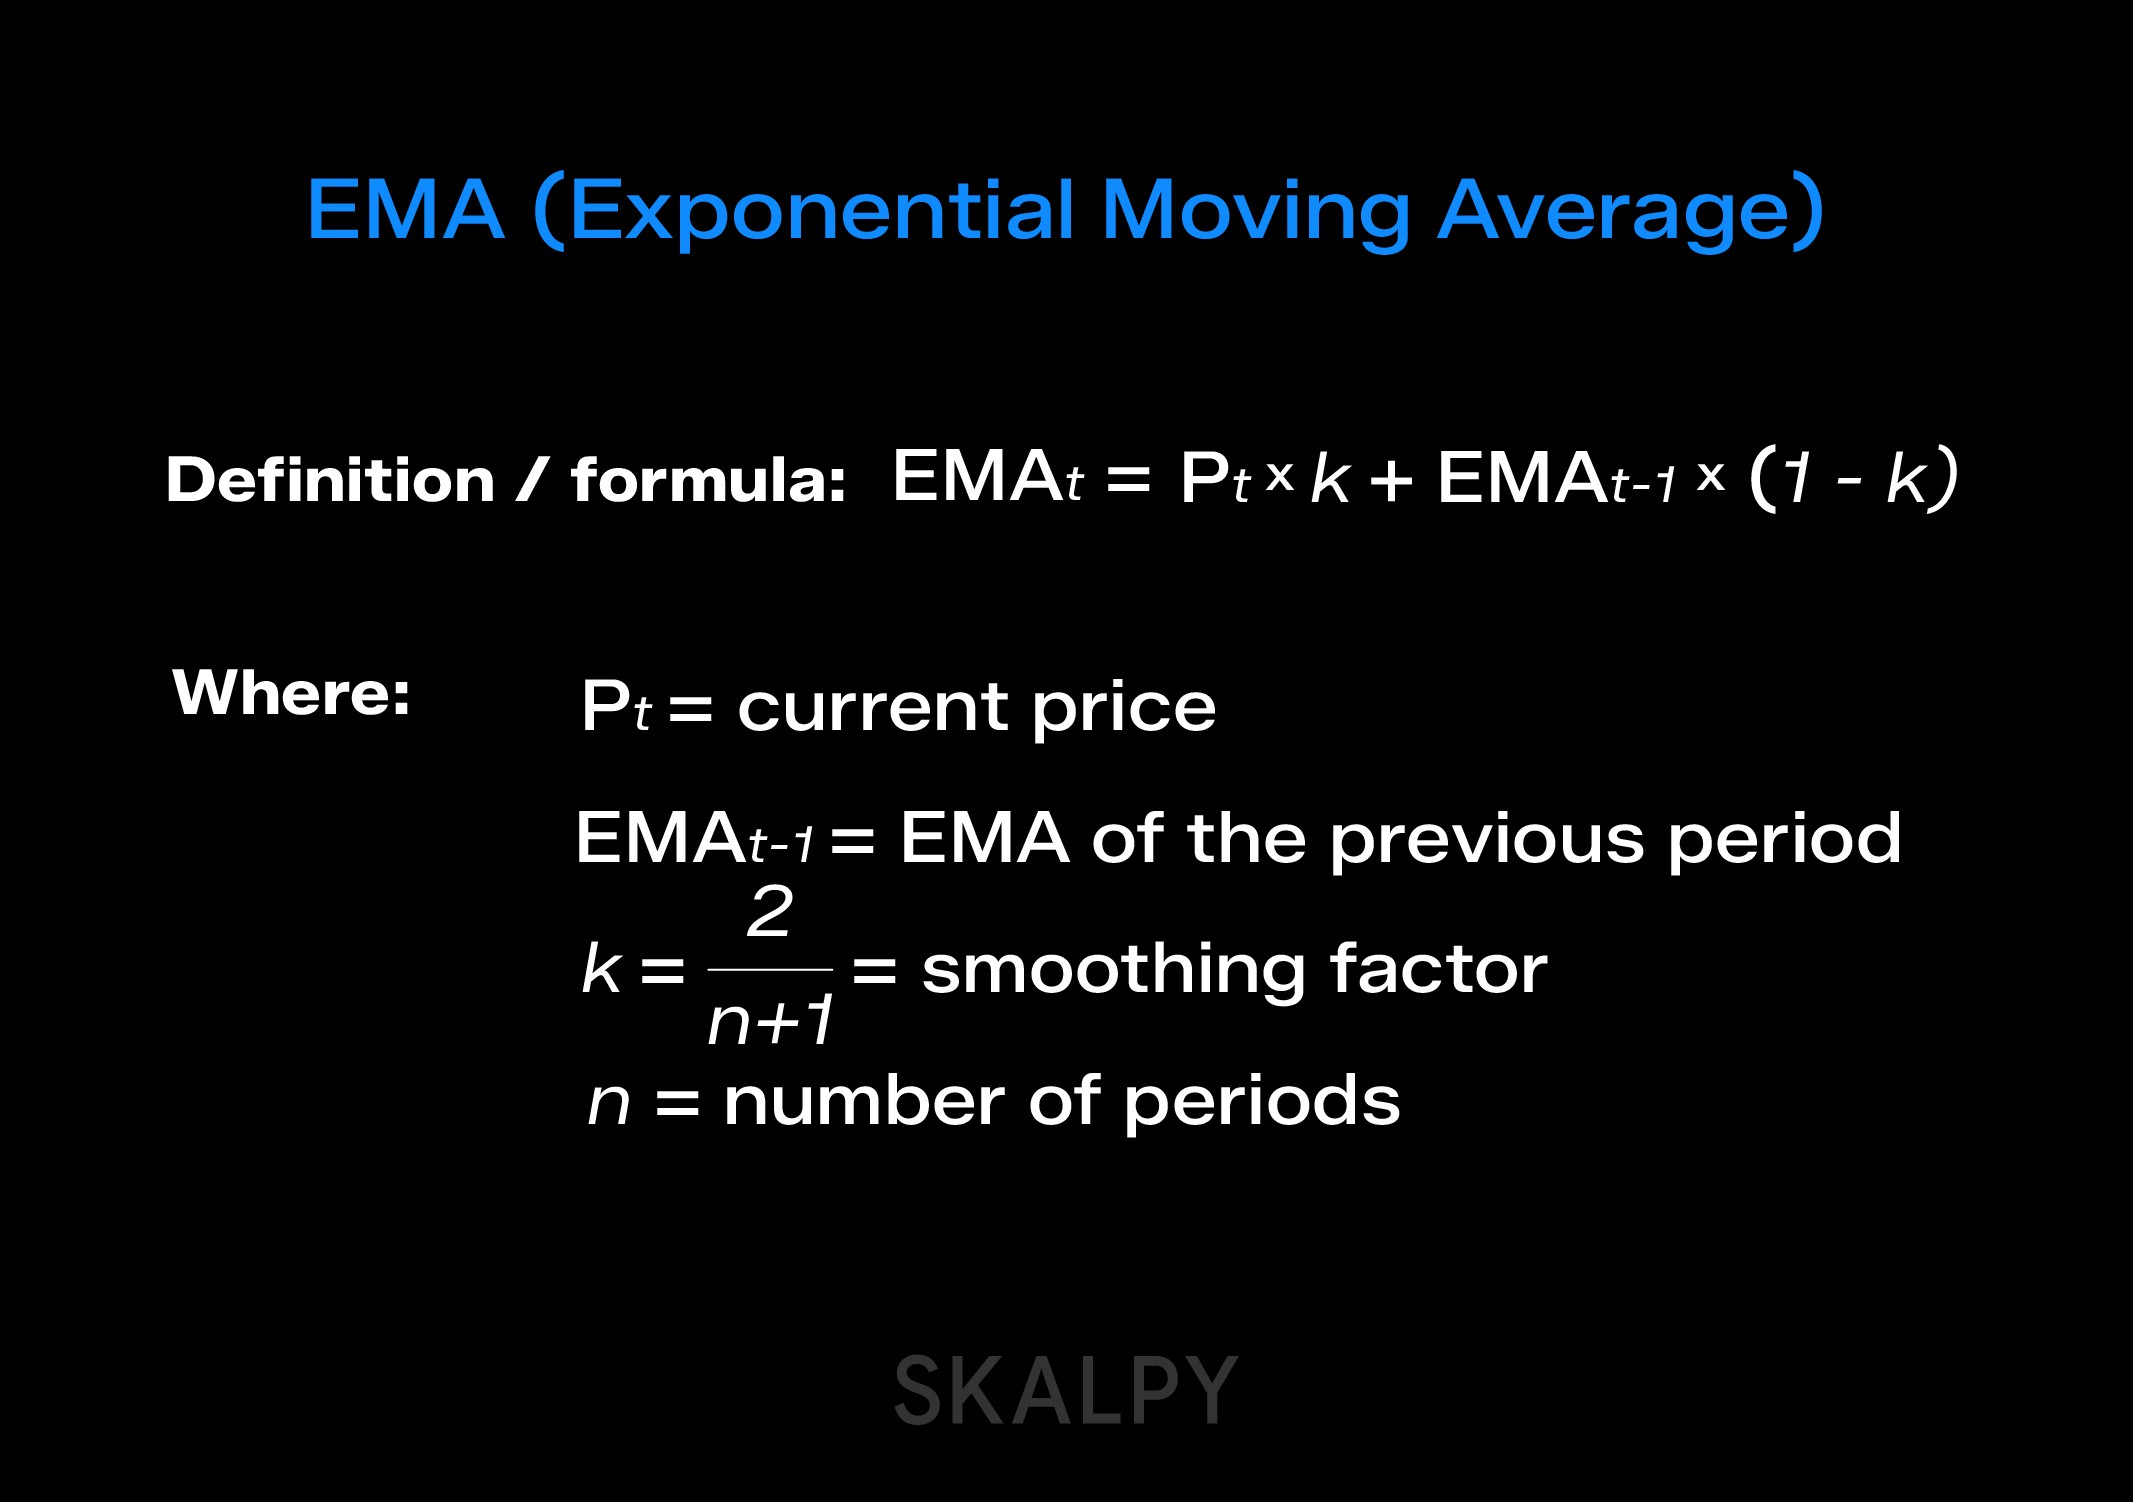
Exponential Moving Average (EMA)
The exponential moving average addresses the uniform weighting concern by giving preference to current prices. The calculation is more intricate than the SMA, yet the advantage lies in a more sensitive indicator that identifies abrupt price modifications and possible reversals more rapidly.
This swift responsiveness makes EMAs particularly favored among intraday traders and scalpers who require immediate signals. Shorter-term traders frequently select EMAs precisely because they recognize momentum transformations sooner than simple moving averages.
Practical Application: Selecting Your Timeframe
The postponement in moving averages relates directly to the quantity of data being examined. A 100-day MA reacts considerably more gradually to new information compared to a 10-day MA since each incoming data point influences the total average less substantially.
Which method proves superior? That relies completely on your trading methodology:
Extended-horizon investors benefit from prolonged periods (50, 100, or 200 days) since these configurations prevent excessive reactions to transient volatility.
Brief-period traders favor condensed timeframes (10-20 days or even hours) for more instantaneous signals.
Within conventional stock markets, the 50-day, 100-day, and 200-day moving averages function as benchmark standards. Cryptocurrency traders implement comparable timeframes, although the continuous nature of crypto markets frequently necessitates strategic modifications. Whether you examine hourly fluctuations or weekly configurations, preserving alignment between your timeframe and trading methodology remains essential.
Dynamic traders who focus on rapid execution and scalping strategies can utilize platforms like Skaply to capitalize on short-term price movements once they've identified potential opportunities through their analysis.
Interpreting Crossover Signals
An individual moving average can display general trend orientation: ascending MA indicates uptrend, descending MA indicates downtrend. However, the genuine analytical strength materializes when merging multiple MAs to detect crossover signals.
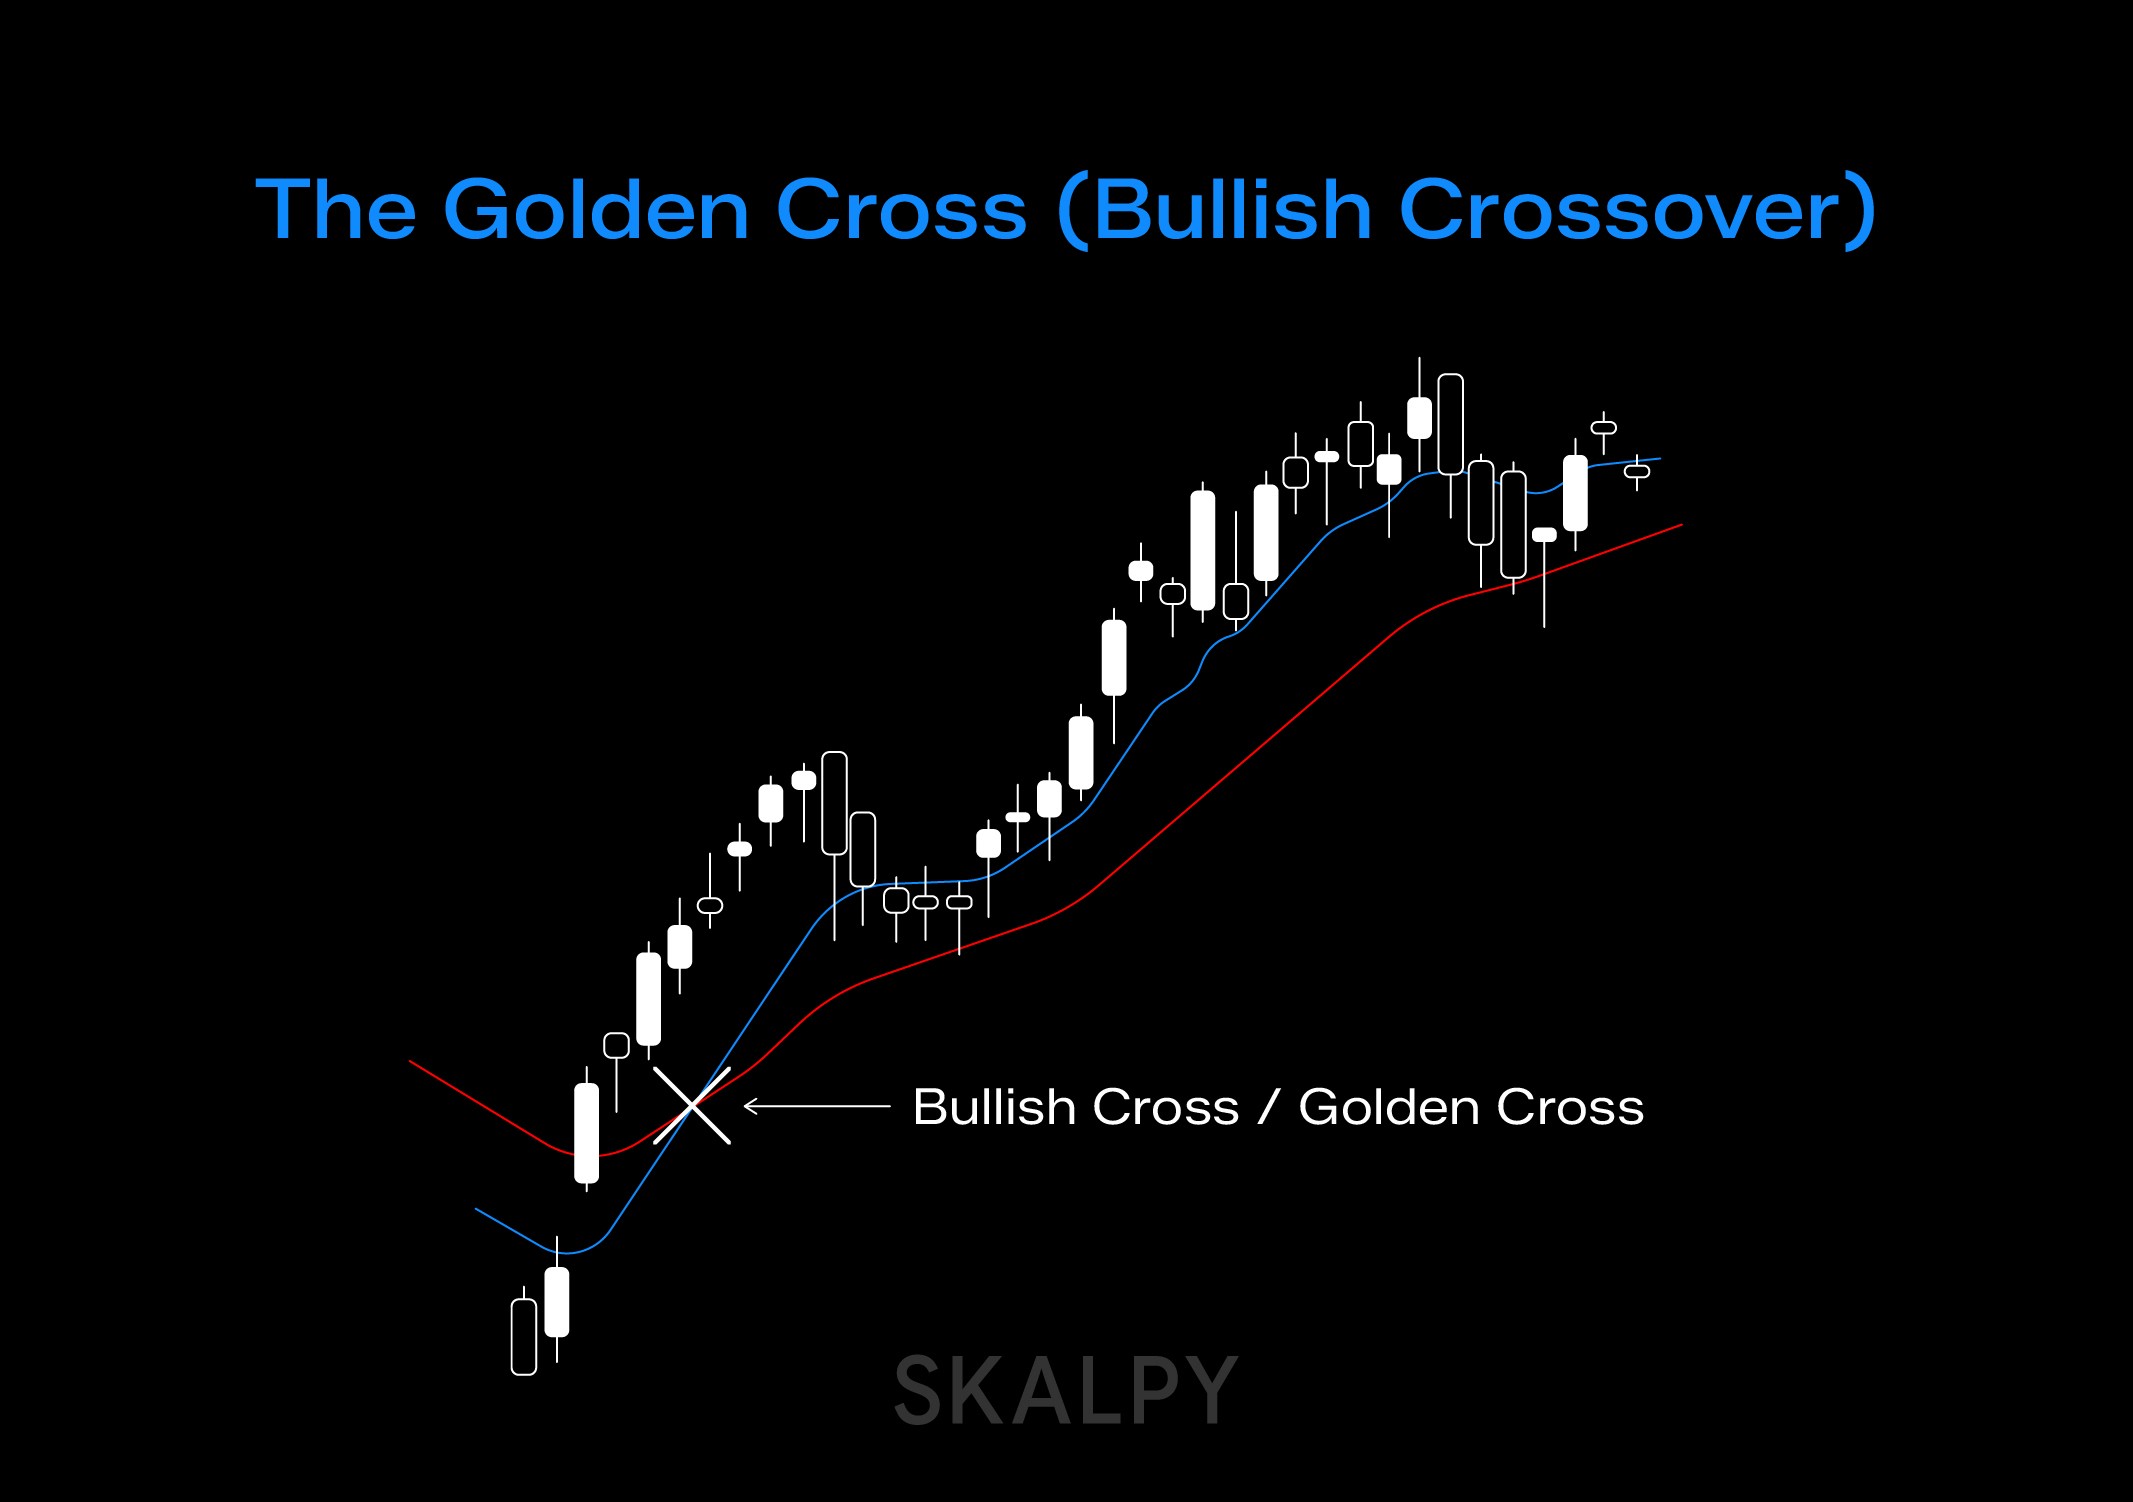
The Golden Cross (Bullish Crossover)
When a shorter-term MA ascends above a longer-term MA, this formation indicates the commencement of an upward trend. Traders commonly construe this as a purchase signal, demonstrating intensifying upward momentum.
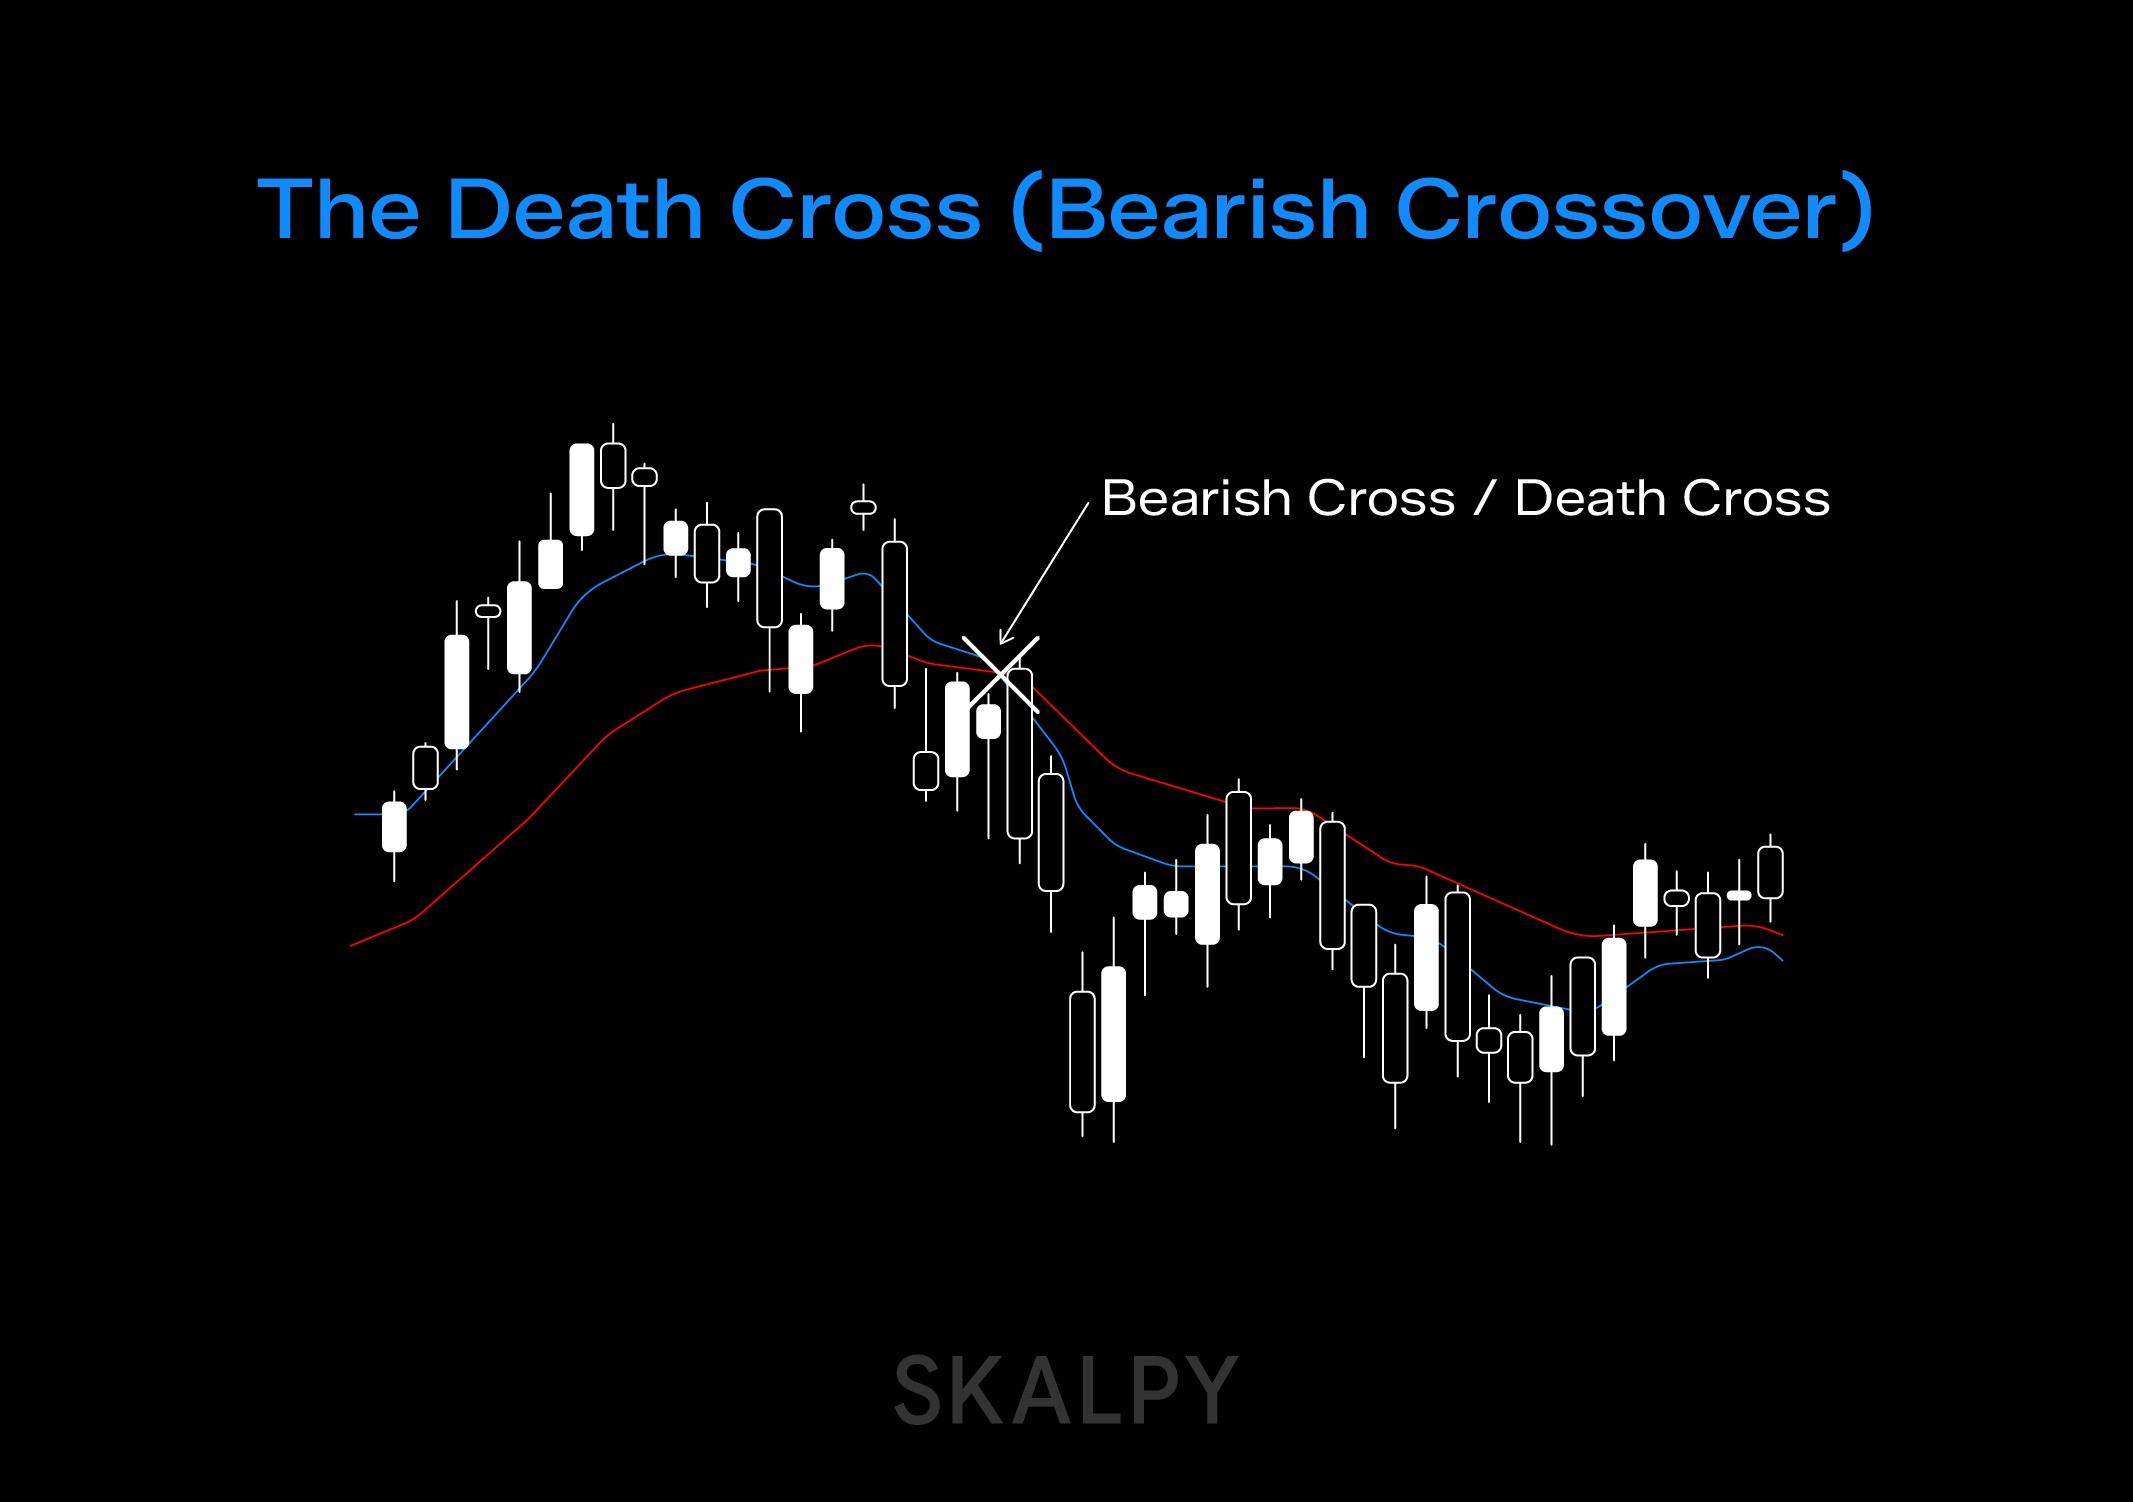
The Death Cross (Bearish Crossover)
The reverse transpires when a shorter-term MA descends beneath a longer-term MA. This formation signifies prospective downward momentum and typically receives interpretation as a selling signal.
Critical Limitations Worth Noting
Although moving averages provide considerable analytical capability, they aren't without flaws. Their fundamental weakness originates from built-in postponement. Once a crossover signal becomes visible, substantial price action may have already transpired. You could obtain a bullish crossover indication only following a situation where prices have already escalated meaningfully, translating to forfeited early profit opportunities.
More concerning are "bull traps," representing deceptive signals that recommend purchasing at what transforms into a regional peak immediately preceding price declines. A golden cross offers no assurance of sustained upward progression. It merely mirrors what has unfolded in the recent past.
This clarifies why experienced traders never rely solely on moving averages. Merging MAs with supplementary technical indicators such as RSI, MACD, or volume examination constructs a more thorough analytical structure and assists in filtering out misleading signals.
Concluding Observations
Moving averages persist among the most functional instruments in technical analysis, supported by legitimate reasoning. They furnish data-oriented insights into market trends and aid traders in formulating better-informed selections. Whether you maintain positions over extended periods or engage in active scalping, mastering how to decode and implement these indicators can substantially elevate your trading outcomes.
Bear in mind that successful trading necessitates a holistic approach. View moving averages as a single element within an expansive analytical framework, remain aware of their constraints, and consistently assess multiple indicators prior to executing transactions. For traders pursuing streamlined execution and rapid order placement in today's swiftly transforming crypto markets, platforms like Skaply furnish the foundation needed for efficient trade execution once opportunities have been identified.

Scalping
Choosing the Right Crypto Assets for Scalping Success
Learn how to select the best cryptocurrencies for scalping based on liquidity, volatility, spreads, and volume to maximize your scalping profitability.
Trading
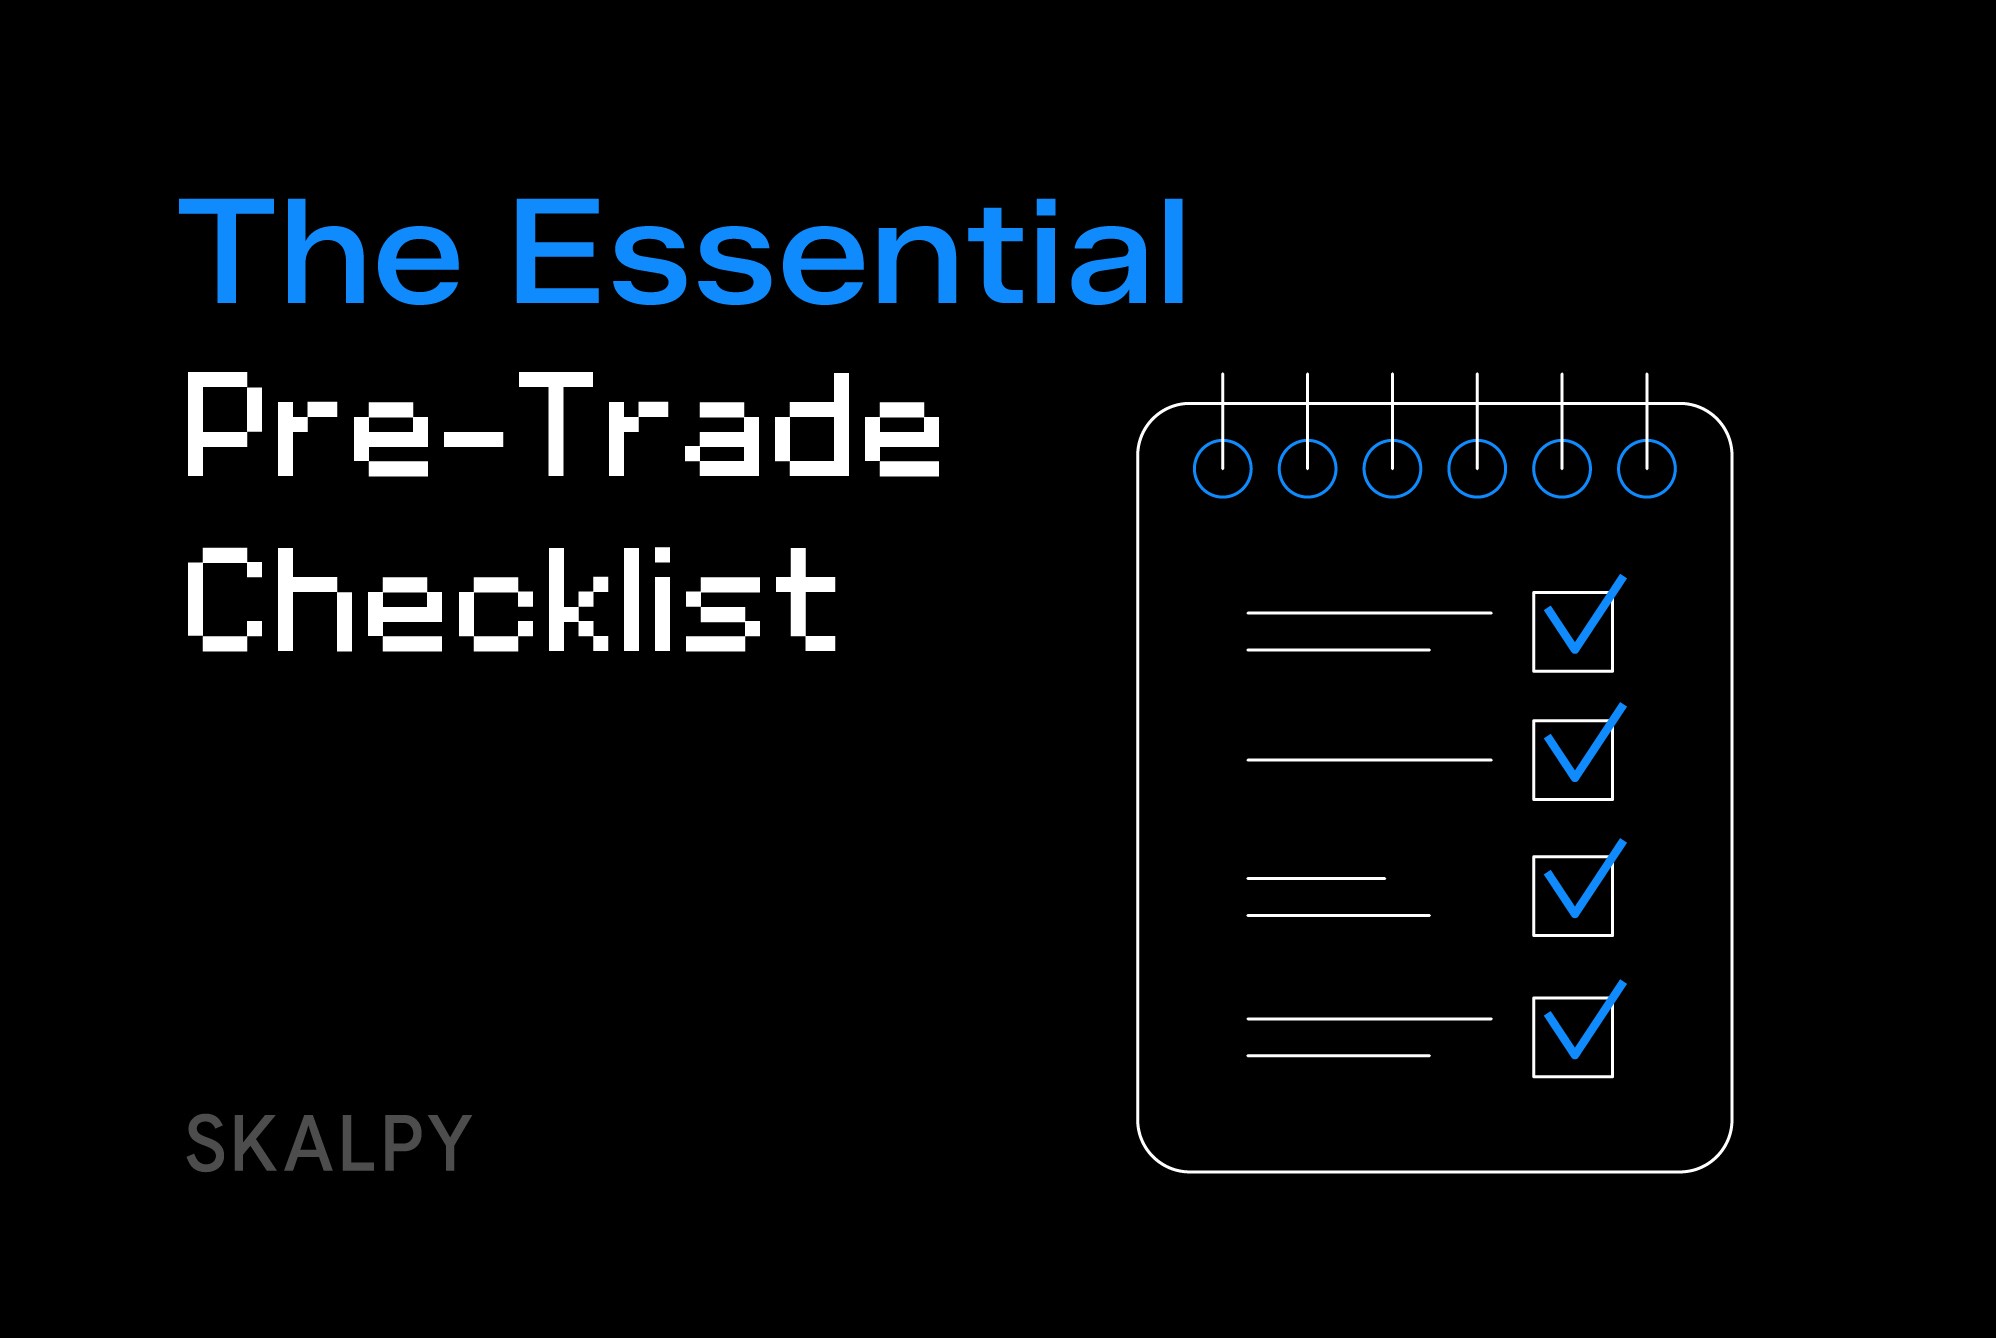
The Essential Pre-Trade Checklist: Never Enter Without These Confirmations
Use this comprehensive trading checklist before every trade to confirm setups, manage risk properly, and avoid impulsive decisions that lead to losses.
Trading
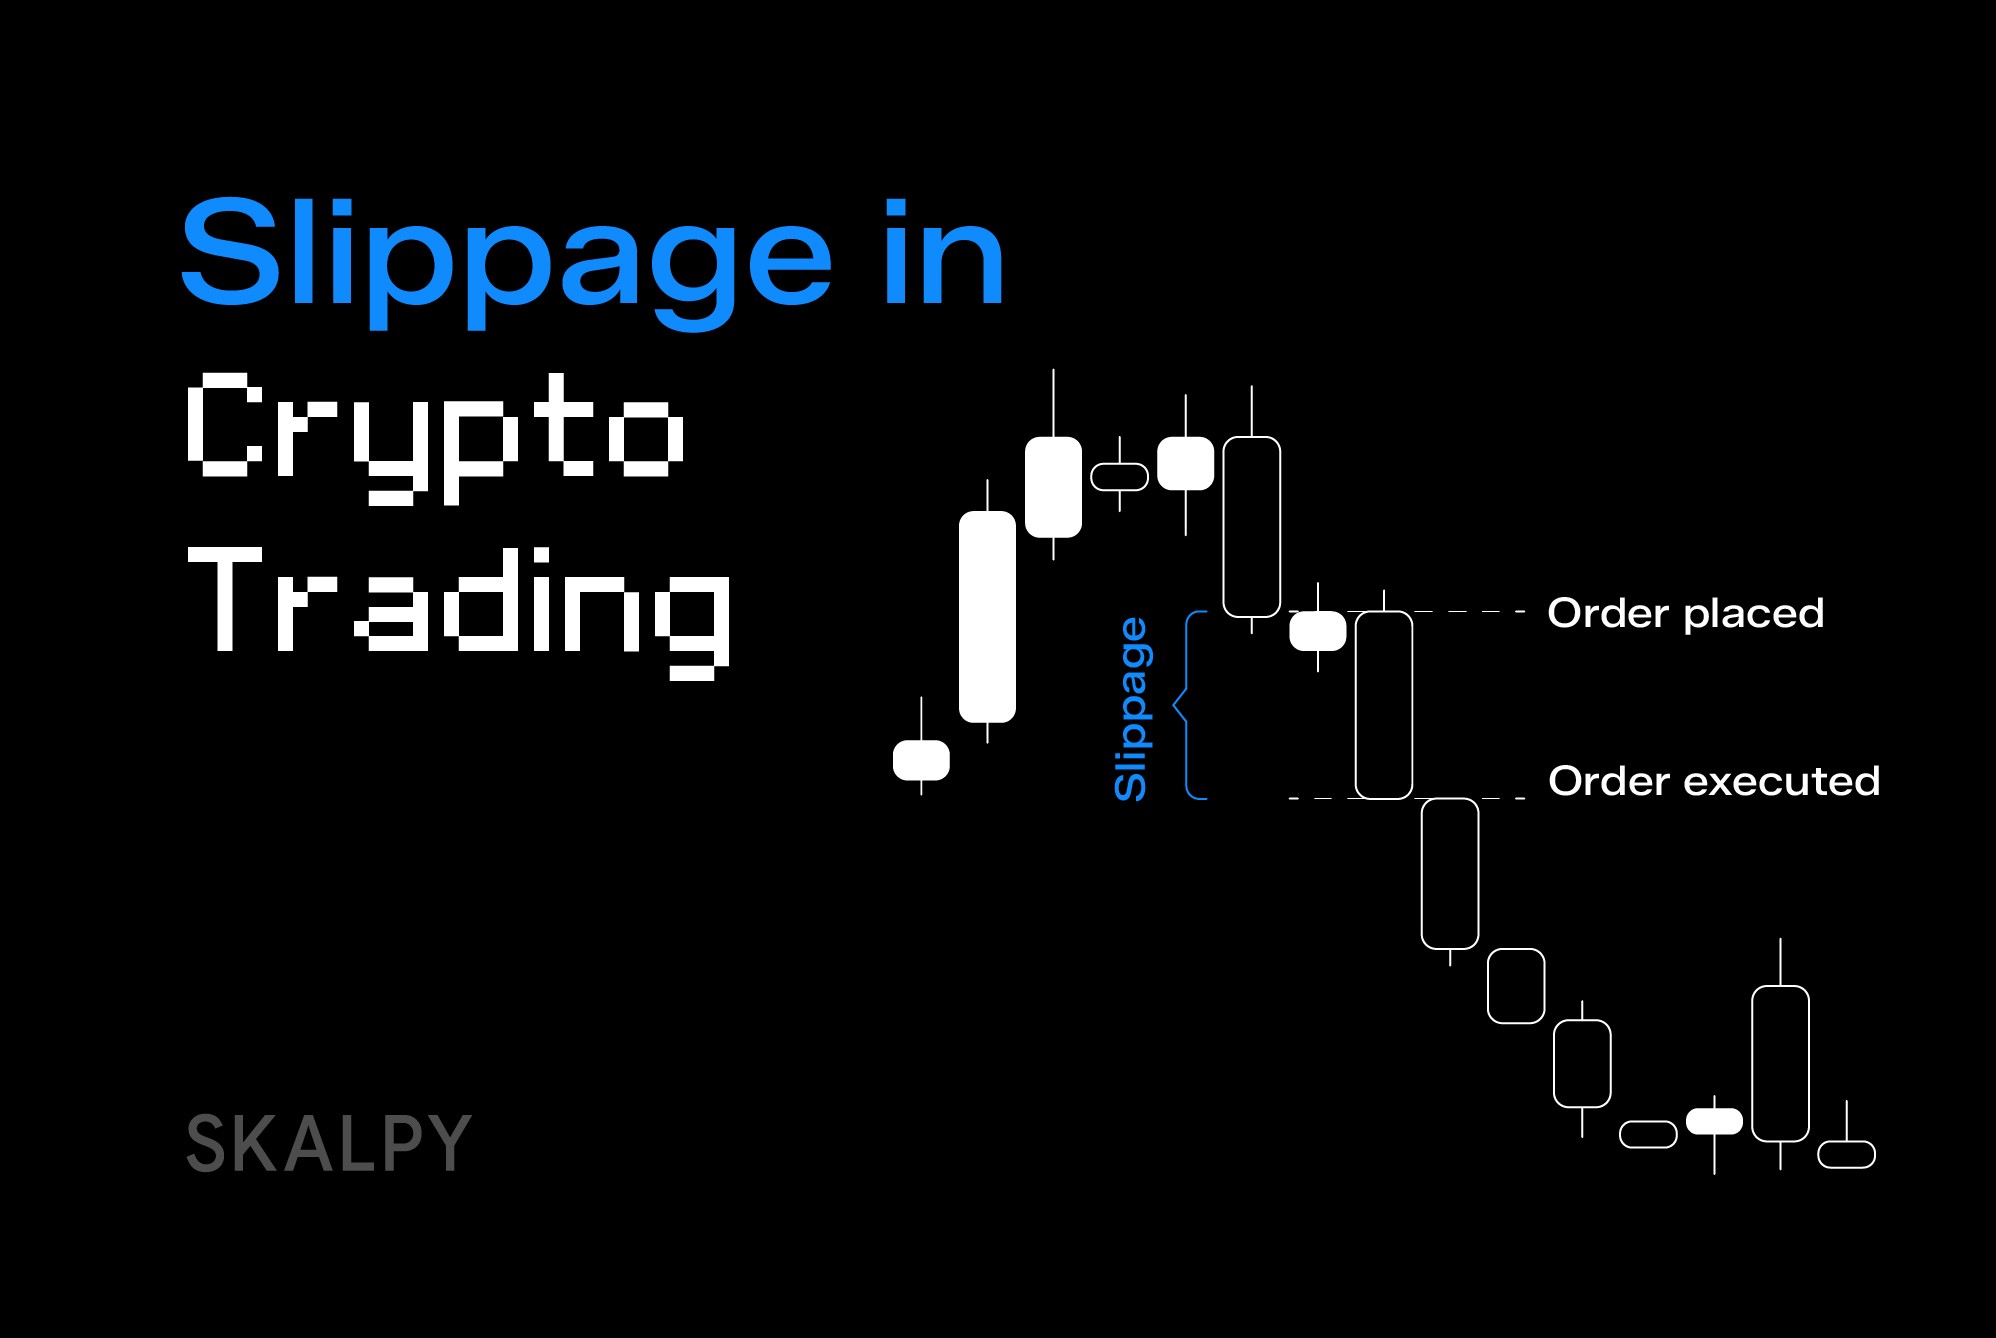
Slippage in Crypto Trading: What It Is and How to Minimize It
Discover what slippage is in crypto trading, why it happens during volatile markets, and learn practical strategies to minimize slippage and protect your profits.

