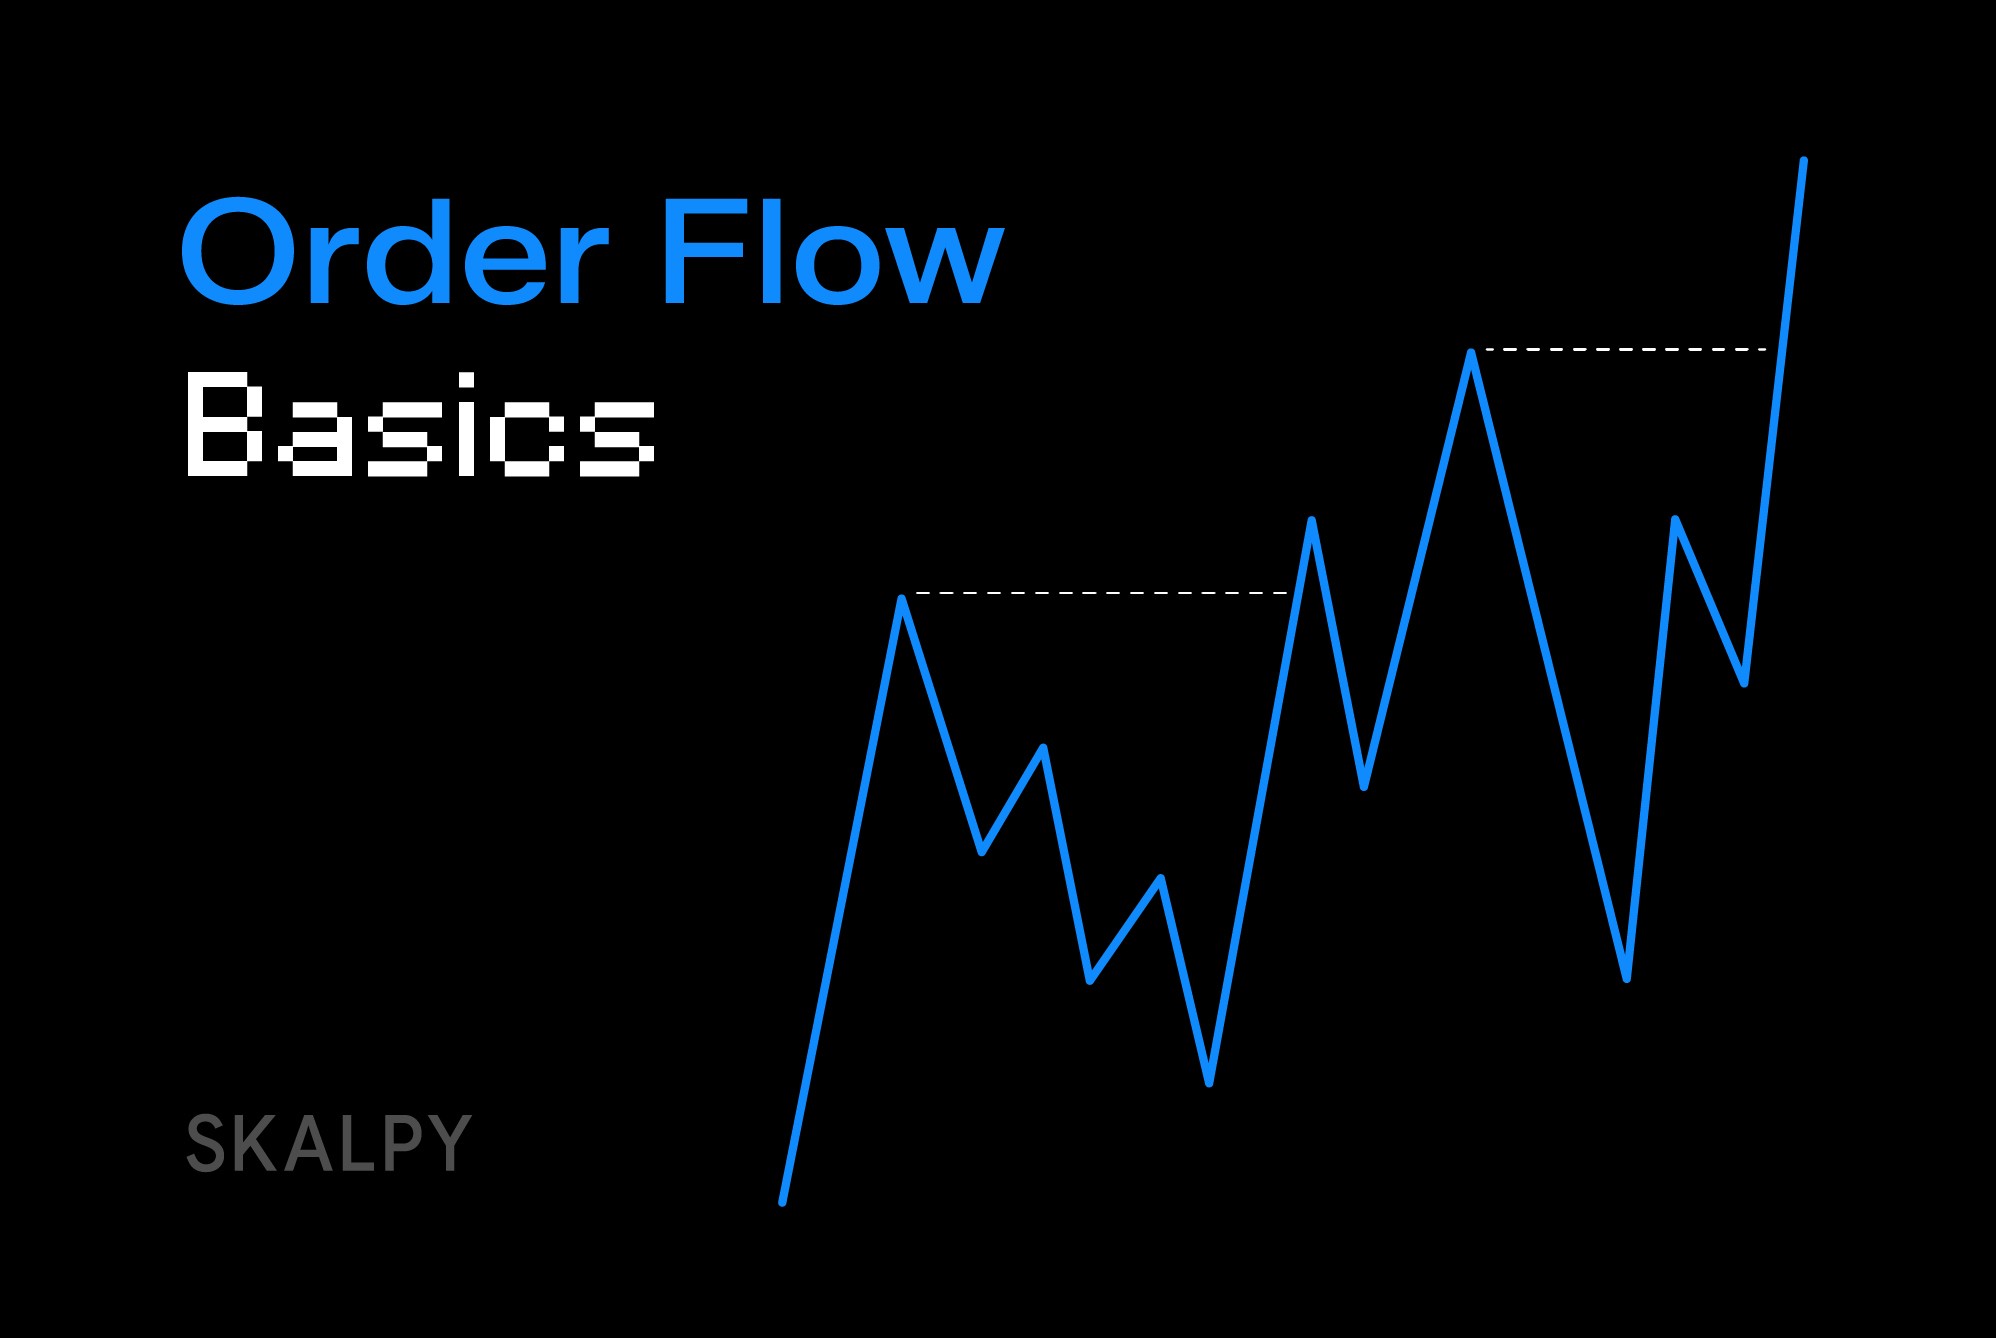
Price charts tell you what happened. Order flow tells you why it happened and what might happen next. While most traders rely solely on candlesticks and indicators, order flow traders peer beneath the surface to see the actual buying and selling pressure driving those price movements.
Understanding order flow transforms trading from reacting to price changes to anticipating them based on real-time market participation. For scalpers and active traders, this edge can mean the difference between consistent profitability and frustration.
What Is Order Flow?
Order flow refers to the stream of buy and sell orders entering the market. It's the actual transactions occurring between buyers and sellers, the real money changing hands that creates price movement. Every price change happens because an order was filled, making order flow the purest form of market information.
Traditional price charts show you open, high, low, and close for each period. Order flow data shows you how many contracts or coins traded at each price level, whether buyers or sellers were more aggressive, and where the largest transactions occurred. This granular information reveals market dynamics that simple candlesticks cannot.
For example, a bullish green candle might suggest buyers are in control. But order flow analysis might reveal that most volume occurred on the bid (sellers hitting bids), with buyers only lifting offers in the final moments. This divergence signals potential weakness despite the bullish appearance.
Key Components of Order Flow Analysis
Volume at Price
This shows how much volume traded at each specific price level during the period. High-volume nodes indicate areas where significant transactions occurred, often representing fair value zones where both buyers and sellers agreed to transact. Low-volume areas suggest prices that market participants found unattractive, which often become areas where price moves quickly when revisited.
Bid vs Ask Aggression
Every trade has two sides: someone buying and someone selling. What matters is who was the aggressor. When buyers are aggressive, they "lift the offer" by taking available sell orders. When sellers are aggressive, they "hit the bid" by taking available buy orders.
Tracking the balance between bid and ask aggression reveals true sentiment. Strong upward price movement with mostly bid volume (sellers aggressive) suggests the move lacks conviction and may reverse. Strong upward movement with mostly ask volume (buyers aggressive) confirms genuine buying pressure.
Delta
Delta measures the difference between buying volume and selling volume. Positive delta means more buying volume (buyers lifting offers). Negative delta means more selling volume (sellers hitting bids). Delta helps identify divergences between price and order flow.
If price makes new highs but delta is negative, it suggests the rally is driven by lack of sellers rather than aggressive buying. This often precedes reversals. Conversely, price making new lows with positive delta suggests the decline is driven by lack of buyers, not aggressive selling, potentially indicating a reversal higher.
Cumulative Delta
While delta measures buying vs selling pressure for individual bars or periods, cumulative delta (CVD) tracks the running total across multiple bars. CVD creates a line that shows the overall balance of aggression over time.
Rising CVD with rising price confirms the trend. Rising price with falling CVD (divergence) suggests weakening buying pressure despite higher prices, a warning signal. Falling price with rising CVD suggests accumulation during the decline, potentially indicating a bottom.
Large Trades (Prints)
Order flow platforms highlight unusually large trades that exceed typical transaction size. These "big prints" often represent institutional or whale activity and can signal important levels where large players are positioning.
A cluster of large buy orders at a specific price level suggests strong support. Large sell orders indicate resistance. Watching where these significant transactions occur helps identify levels that matter to participants moving real capital.
How Order Flow Differs from Price Action
Price action trading analyzes candlestick patterns, support and resistance, and chart formations. These methods work but rely on lagging information since they only show where price has been.
Order flow trading analyzes what's happening inside each candle as it forms. You see buying and selling pressure in real-time, allowing you to anticipate price movement before the candle closes. This forward-looking perspective provides an edge over traders waiting for candlestick confirmation.
For example, price action traders might wait for a bullish engulfing pattern to confirm a reversal. Order flow traders see the shift from selling to buying pressure developing during the formation of those candles, allowing earlier entries with better risk-reward.
Order Flow in Crypto Markets
Cryptocurrency markets present unique order flow characteristics compared to traditional markets.
24/7 Trading
Crypto markets never close, creating continuous order flow. However, liquidity and participation vary significantly by time of day. Order flow analysis helps identify when major participants are active versus when markets are thin and prone to manipulation.
Exchange Fragmentation
Unlike centralized stock exchanges, crypto liquidity is split across multiple venues. Order flow on Binance may differ from Coinbase or Kraken for the same asset. Serious order flow traders monitor multiple exchanges or focus on the venue with the deepest liquidity.
Whale Activity
Large holders (whales) have outsized influence in crypto markets. Order flow analysis helps identify when whales are accumulating or distributing by spotting large transaction clusters and unusual buying or selling pressure.
Lower Liquidity Than Traditional Markets
Crypto markets, even major pairs, have less liquidity than forex or stock index futures. This makes order flow even more valuable since individual large orders can move markets noticeably. Seeing these orders in real-time provides actionable information.
Practical Order Flow Trading Strategies
Absorption
Absorption occurs when price tests a level repeatedly but can't break through despite apparent pressure. Order flow shows large volume transacting at that level without price movement, indicating a big player is "absorbing" the orders.
For example, Bitcoin tests $29,000 resistance three times with increasing selling pressure, but price doesn't break lower. Order flow reveals massive buying volume at $29,000, with a large player absorbing all selling. This often precedes a strong reversal as the absorber has removed supply.
Exhaustion
Price makes an extended move but order flow shows diminishing aggression in the trend direction. For instance, Bitcoin rallies from $28,000 to $30,000, but cumulative delta peaks at $29,500 and starts declining even as price continues higher. This divergence signals buying exhaustion and potential reversal.
Iceberg Orders
Large players often hide their true size using iceberg orders that only show a small portion. Order flow reveals these by showing repeated fills at the same price without the displayed size decreasing significantly. Identifying iceberg orders shows where major players are defending levels.
Volume Imbalances
When significantly more volume trades at the bid versus ask (or vice versa) during a move, it creates an imbalance. Strong moves typically show imbalances in the direction of the trend. When imbalances shift against the price direction, it warns of potential reversals.
Order Flow for Scalping
Scalpers benefit tremendously from order flow analysis since they operate on the shortest timeframes where every tick matters.
Entry Timing
Order flow helps scalpers time entries with precision. Rather than entering randomly within a support zone, order flow shows exactly when buying pressure increases, allowing entries at the optimal moment with minimal adverse movement.
Quick Exits
When order flow shifts against your position, it provides early warning to exit before price moves significantly. Scalpers using platforms like Skaply can react to order flow changes within seconds, protecting profits or minimizing losses.
Reading Momentum
Order flow reveals whether momentum is genuine or artificial. A quick spike on thin volume with minimal aggression often reverses quickly. A steady grind on consistent aggressive volume has follow-through potential. Scalpers use this distinction to stay in winning trades longer and exit false moves quickly.
Level Confirmation
Before scalping a bounce from support or rejection from resistance, order flow confirms whether the level is being defended. If buying volume increases as price approaches support, it validates the level. If buying remains weak, the level will likely break.
Tools and Platforms for Order Flow
Footprint Charts
Footprint charts display volume at each price level within each bar, color-coded by buying vs selling aggression. This visualization makes order flow intuitive and actionable.
Time and Sales (Tape Reading)
The time and sales window shows every individual trade in chronological order. Experienced traders "read the tape" to sense momentum shifts, identify large orders, and gauge urgency.
Depth of Market (DOM)
The DOM displays current buy and sell orders in the order book at each price level. While the book can be spoofed, watching how it changes as price approaches levels provides valuable information.
Delta and CVD Indicators
Many platforms offer delta and cumulative delta indicators that plot buying vs selling pressure beneath price charts, making divergences easy to spot.
For crypto traders, finding platforms that provide clean order flow data with minimal lag is crucial. The speed advantage matters enormously when trading based on real-time flow.
Limitations and Considerations
Spoofing
Large orders can be placed with no intention of execution, designed to create false impressions of support or resistance. These orders disappear before price reaches them. Experienced order flow traders learn to distinguish genuine orders from spoofs.
Exchange-Specific Data
Order flow on one exchange doesn't necessarily reflect activity on others. For comprehensive analysis, monitoring multiple venues is ideal, though this increases complexity.
Learning Curve
Order flow analysis requires significant practice to read effectively. Unlike following a simple indicator, understanding order flow nuances takes screen time and experience. The investment pays off but demands commitment.
Information Overload
Too much data can be paralyzing. Focus on the key metrics relevant to your strategy rather than trying to process everything simultaneously. Most successful order flow traders use 2-3 key indicators rather than overwhelming themselves.
Combining Order Flow with Technical Analysis
Order flow works best when combined with traditional technical analysis rather than replacing it entirely.
Technical Analysis for Context
Use traditional support and resistance, trend lines, and patterns to identify key levels and potential setups. Technical analysis provides the "where" and "what."
Order Flow for Execution
Use order flow to time entries and exits precisely at those levels. Order flow provides the "when" and "how much conviction."
For example, technical analysis identifies $29,000 as important support on Bitcoin. As price approaches, order flow shows whether buying pressure is increasing (trade the bounce) or remaining weak (wait or fade the level).
The Bottom Line
Order flow trading reveals the market's true intentions by showing actual buying and selling pressure rather than just price results. This deeper understanding allows traders to anticipate moves, time entries precisely, and identify high-probability setups that others miss.
The learning curve is steep, requiring dedication to understand the nuances of volume, delta, aggression, and flow patterns. However, traders who master order flow gain a significant edge, particularly in fast-moving markets where split-second decisions determine profitability.
For scalpers and active traders, order flow analysis isn't optional luxury but essential information. The market's true story is written in its order flow. Learning to read that story accurately separates professionals who consistently extract profits from those who struggle trying to trade based on delayed, superficial information.
Start simple. Focus on understanding volume at price and delta before adding complexity. Practice reading flow during replay sessions or paper trading before risking capital. Over time, order flow becomes intuitive, providing a constant stream of actionable intelligence that transforms your trading decision-making process.