

A strong trend rarely reverses without warning. Retail traders often attempt to predict the exact top or bottom of a move by relying on overbought or oversold oscillators. They blindly step in front of a moving train, hoping the momentum will magically shift. This approach consistently leads to severe drawdowns.
In market microstructure, momentum does not shift by magic. It shifts when aggressive participants run out of capital or encounter an immovable wall of passive liquidity. This phenomenon is known as order flow exhaustion. By learning to read the tape and analyze the order book, you can precisely identify when a trend is dying, allowing you to enter reversal trades with microscopic risk.
The Mechanics of Exhaustion
Markets move based on aggressive market orders consuming passive limit orders. A strong uptrend is fueled by continuous, large market buy orders clearing out the resistance in the order book.
Exhaustion occurs when this dynamic breaks down. There are two primary ways a trend exhausts itself.
Lack of Demand: The aggressive buyers simply run out of ammunition. The buying volume shrinks, and no new participants are willing to hit the market buy button at elevated prices.
Passive Absorption: The aggressive buyers are still present, but they run into a massive institutional seller. The institutional participant places massive limit sell orders (asks), absorbing all the buying pressure without letting the price advance a single tick.
Identifying Exhaustion in the Tape
A candlestick chart will not show you exhaustion until the candle closes, which is often too late. You must monitor the Time and Sales (the tape) in real-time to spot the subtle shifts in momentum. Look for these three critical signals.
1. Deceleration of Order Velocity
During a healthy trend, the tape moves with violent speed. Prints flood the screen rapidly. When exhaustion begins, the first sign is a noticeable drop in tape velocity. The aggressive market orders slow down to a trickle. The market takes a breath, indicating hesitation among the participants driving the trend.
2. Shrinking Execution Size
Pay close attention to the size of the individual prints. In a strong bullish impulse, you will see large blocks of volume hitting the ask. As exhaustion sets in, the print sizes diminish. Instead of seeing blocks of 5 or 10 BTC, the tape starts showing fragmented, microscopic prints like 0.01 or 0.05 BTC. This confirms that large institutional players have stepped away from the move, leaving only retail participants to push the price.
3. High Volume with Zero Progression
This is the ultimate sign of absorption. You observe a sudden flurry of large market buy orders on the tape, yet the price refuses to tick higher. The aggressive buyers are actively hitting the ask, but an invisible wall of limit orders is absorbing every single contract. When this aggressive buying volume results in zero upward progression, a sharp reversal is imminent.
The Software Advantage
Spotting order flow exhaustion requires surgical precision. You must be able to differentiate between a 0.5 BTC print and a 5.0 BTC print instantly.
Standard web exchange interfaces aggregate tick data. They combine multiple smaller trades into one delayed print to save bandwidth. This aggregation hides the true velocity and size of the market participants, making it impossible to spot the nuances of exhaustion.
To execute this strategy, professional traders require raw, unthrottled data. This is why experienced scalpers choose the Skalpy terminal. A dedicated desktop setup provides a clear, unaggregated tape and a low-latency order book. It allows you to see the exact moment the big players step away and the momentum dies, giving you the confidence to execute your reversal trade before the rest of the market reacts.
The Bottom Line
Stop guessing where the market will reverse based on lagging mathematical formulas. The market leaves a precise footprint in the order flow when a trend loses its strength.
Wait for the tape velocity to drop. Watch for the print sizes to shrink. Confirm that aggressive market orders are failing to push the price forward. Once you see these elements align, you have identified order flow exhaustion. Equip yourself with unaggregated data by opting for Skalpy, and start trading the reality of institutional order flow.
Scalping
Beyond PnL: Building a Professional Scalper's Trading Journal
Discover why a trading journal is the ultimate edge for crypto scalpers. Learn how to track market microstructure, analyze execution, and use professional data to eliminate systemic leaks.
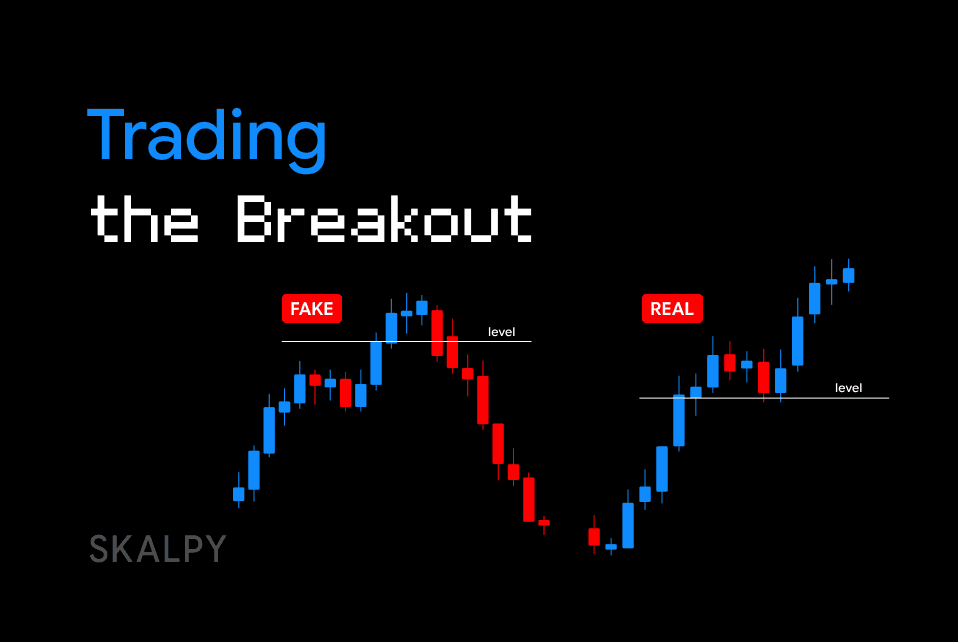
Trading
Trading the Breakout: How to Filter False Breakouts Using Order Book Data
Improve your breakout strategy by understanding market microstructure. Learn how order flow, absorption, and DOM data can help filter false breakouts.
Scalping
Dynamic Position Sizing: Scaling In and Out of Fast-Moving Trades
Learn how professional crypto scalpers use dynamic position sizing, scaling in, and scaling out to maximize profits and minimize risk during fast market movements.