
The human brain is notoriously inefficient at recording reality objectively, especially under conditions of high stress. When a losing trader experiences a draw-down, they frequently attribute the losses to market manipulation, unpredictable volatility, or adverse luck. However, an objective analysis of their last 100 executed positions usually reveals a different reality: taking setups outside of their trading plan, increasing position sizes during draw-downs, or cutting profitable trades prematurely.
The definitive boundary between speculative gambling and professional trading is data collection. A professional trader treats capital allocation as a business operations model, and every structured business requires an accounting infrastructure. In short-term scalping, that infrastructure is the trading journal. Operating without a meticulous record of your execution means trading without statistical visibility. To build an institutional-grade journal that consistently optimizes performance, you must track metrics that reflect the reality of the order book.
Why PnL is a Faulty Metric
The most common error among developing traders is recording only basic data points: the asset ticker, the entry and exit prices, and the final Profit and Loss (PnL).
Focusing exclusively on PnL is fundamentally flawed because it is entirely outcome-oriented. It provides zero insight into the quality of the execution process. For example, a trader can execute a chaotic position driven entirely by FOMO and still realize a profit because of a random influx of market liquidity. A positive PnL in this scenario reinforces a destructive behavioral habit. Conversely, a trader can execute a high-probability setup with flawless risk parameters and still take a systematic stop-loss. A negative PnL might cause them to erroneously abandon a statistically profitable strategy.
A professional journal focuses on the integrity of the process, the underlying market context, and the technical quality of execution.
The Core Metrics of Market Microstructure
To identify your true statistical edge, your journal must track specific variables that isolate performance bottlenecks and reveal behavioral vulnerabilities.
1. Market Context and Order Flow Dynamics
Do not simply record the execution of a trade. Document the exact state of the market microstructure at that specific millisecond. Was the position opened during the New York session open amid institutional volume? Was it executed during a low-liquidity weekend range? Did you enter on a breakout confirmed by limit order absorption, or were you trading a reversal against a spoofed wall? Logging the order flow context helps you identify exactly which liquidity environments match your statistical edge.
2. Strategic Setup Categorization
Assign rigorous categories to every position. Establish specific structural tags such as "Resistance Breakout," "First Order-Book Pullback," or "Liquidity Sweep." After compiling data for 100 trades, you may discover that your breakout strategies yield a 60% win rate, while your pullback strategies operate at a net loss. This data allows you to systematically eliminate underperforming setups and reallocate capital to your highest-yielding strategies.
3. Execution Quality and Slippage Tracking
Scalping is an optimization game where fractions of a tick determine long-term expectancy. You must actively log your intended entry price against your actual fill price. Consistent, severe slippage across your data highlights a critical operational issue: either your technical latency is too high, or you are reacting late when the order book tape has already accelerated.
4. Quantitative Emotional Tracking
Objectively record your psychological state prior to committing capital. Maintain an operational column to log variables such as frustration from a prior loss, fear of missing out, or absolute adherence to predetermined risk rules. Correlating your emotional state with your trading results allows you to identify the specific psychological catalysts that precede your largest equity draw-downs.
The Performance Feedback Loop
Compiling data is irrelevant without structured analysis. Dedicate an isolated operational window every weekend to audit your journal.
Isolate the variables present in your losing trades. Determine if your draw-downs are correlated with specific trading days, low-liquidity sessions, or positions executed against the higher-timeframe trend. Once you identify a systematic leak, implement a binding operational rule to eliminate it. Conversely, isolate your highest-performing setups. Memorize their specific order flow signatures in the DOM, and commit your focus to executing those high-probability environments exclusively.
Technical Accuracy Dictates Data Quality
Successful journaling requires absolute empirical precision. If your execution relies on a lagging, browser-based web interface, your data is fundamentally corrupted. It becomes impossible to determine if a poor fill was caused by an execution error or an exchange interface freeze.
This is the primary reason professional scalpers use Skalpy. Executing trades through a dedicated desktop terminal provides the microsecond precision necessary for high-frequency analysis. Utilizing customized hotkeys and an ultra-low latency order book ensures your entry and exit points represent your actual trading decisions rather than technical lag. Reliable execution creates pristine data, and pristine data forms the foundation of consistent profitability. Establish your journal today, and let mathematical validation govern your risk.

Trading
Beating Analysis Paralysis: How to Survive Information Overload in Crypto Scalping
Overcome analysis paralysis in crypto trading. Learn how to filter market noise, streamline your workspace, and focus purely on order flow execution.
Trading
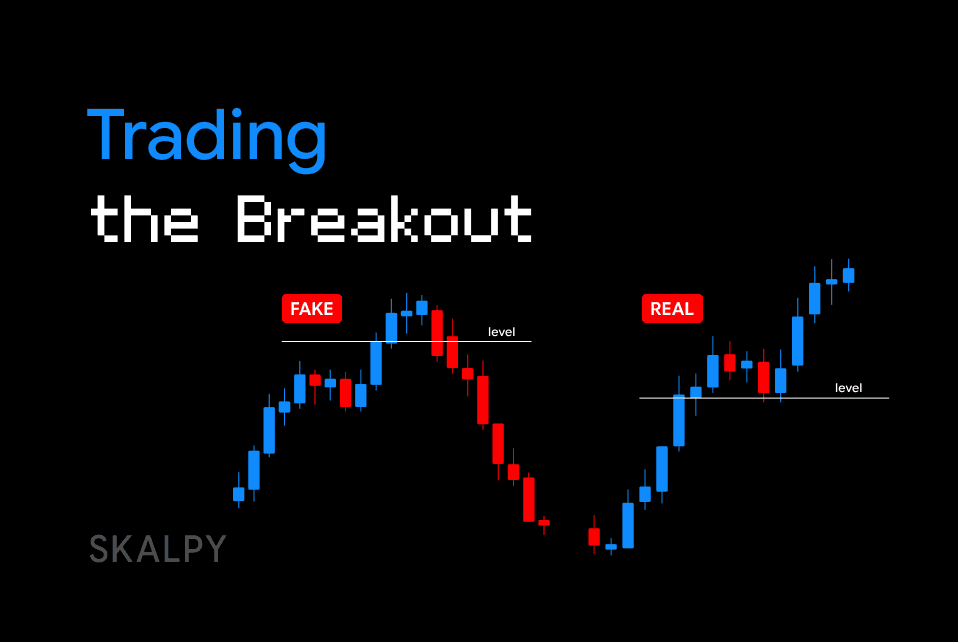
Trading the Breakout: How to Filter False Breakouts Using Order Book Data
Improve your breakout strategy by understanding market microstructure. Learn how order flow, absorption, and DOM data can help filter false breakouts.
Scalping
Dynamic Position Sizing: Scaling In and Out of Fast-Moving Trades
Learn how professional crypto scalpers use dynamic position sizing, scaling in, and scaling out to maximize profits and minimize risk during fast market movements.