False breakouts are one of the most frustrating yet common occurrences in trading. You see price breaking through a key level with conviction, enter the trade expecting continuation, only to watch price reverse sharply and stop you out. Understanding false breakouts and learning to identify them early can save you significant capital and emotional energy.
What Is a False Breakout?
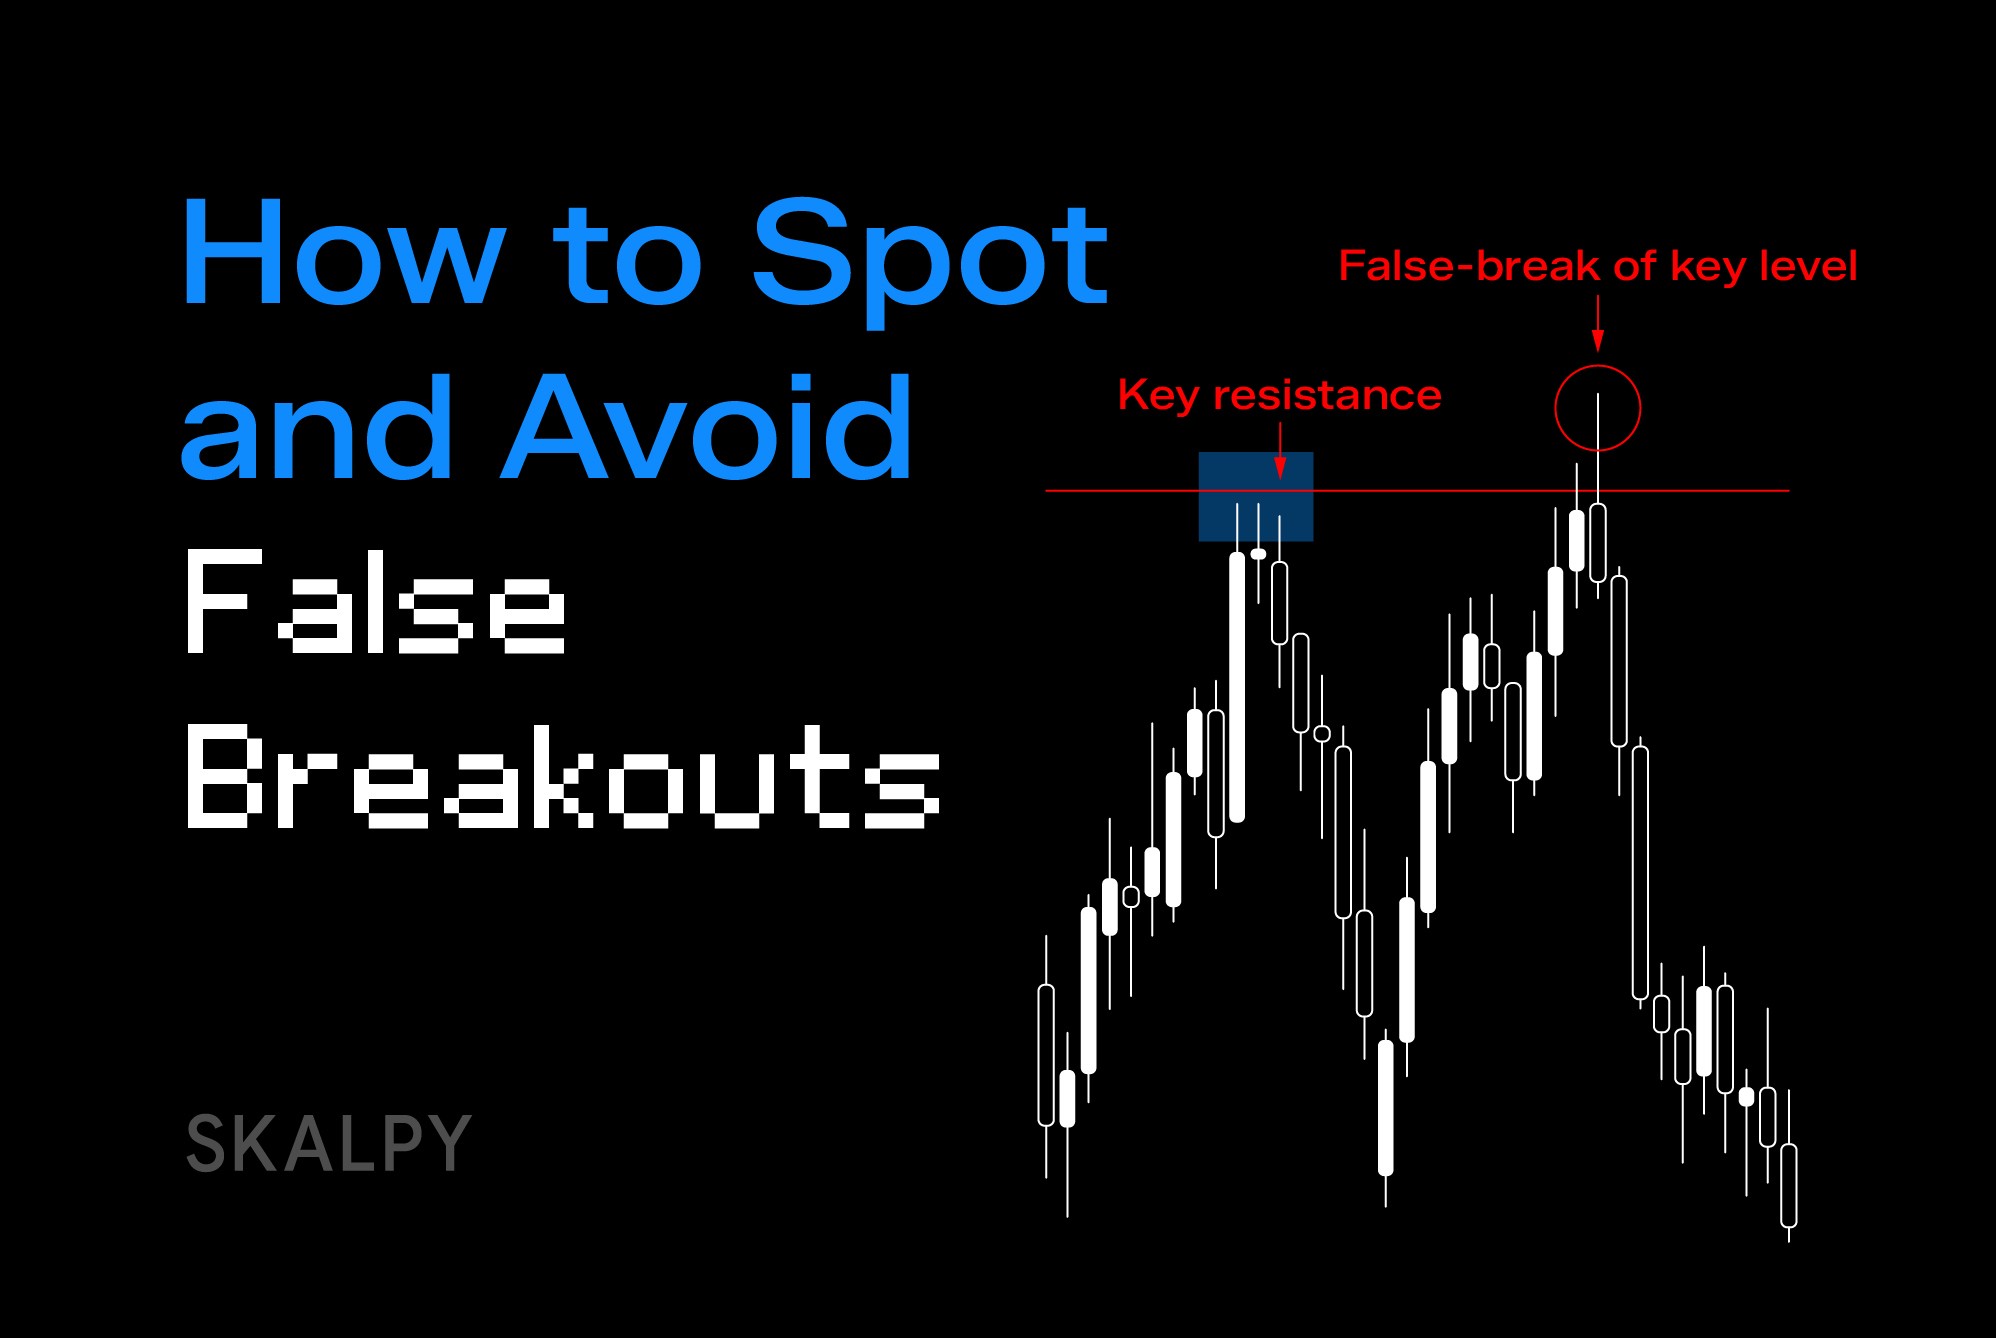
A false breakout, also called a "fakeout" or "failed breakout," occurs when price briefly moves beyond a significant support or resistance level but fails to sustain that move. Instead of continuing in the breakout direction, price quickly reverses back within the previous range.
For example, Bitcoin trades in a range between $28,000 and $30,000 for several days. Price suddenly spikes above $30,000, triggering breakout entries from traders expecting upside continuation. Within minutes or hours, price falls back below $30,000, trapping those who bought the breakout.
False breakouts shake out traders positioned for the breakout while setting up moves in the opposite direction. They're not random market noise but often deliberate market behavior clearing liquidity before the true move begins.
Why False Breakouts Happen
Stop Loss Hunting
Large traders and market makers know where retail stops cluster: just beyond obvious support and resistance levels. By pushing price briefly through these levels, they trigger stops, creating liquidity for their larger positions. Once stops are filled, price reverses.
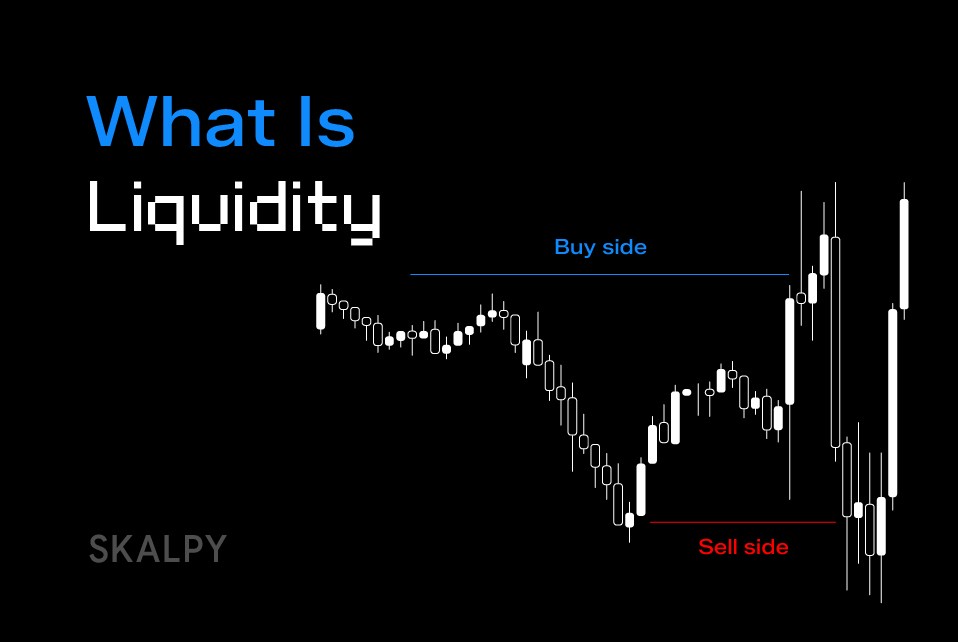
Liquidity Grabs
Markets need liquidity to facilitate large orders. When a big player wants to accumulate a significant position, they need sellers. A quick spike above resistance triggers sell orders and stops from longs, providing the liquidity needed. After absorbing this liquidity, price reverses to the true direction.
Weak Hands Clearing
False breakouts shake out traders with weak conviction who enter based purely on technical level breaks without confirming context. This clears the way for the real move by removing participants who would exit at the first sign of adversity.
Insufficient Buying or Selling Pressure
Sometimes breakouts fail simply because there aren't enough participants to sustain the move. The initial push breaks the level, but without follow-through volume and momentum, price can't maintain the breakout and reverts.
Identifying False Breakouts Early
Low Volume on the Breakout
Genuine breakouts typically occur on expanding volume as new participants enter aggressively. False breakouts often happen on relatively low volume, indicating limited conviction. If price breaks a major level but volume is below average, skepticism is warranted.
Lack of Follow-Through
After a genuine breakout, price typically continues moving decisively in the breakout direction with successive candles. False breakouts show hesitation immediately after breaking the level. Price stalls, forms small indecisive candles, or starts retracing quickly.
Extreme Wicks or Spikes
Long wicks extending beyond key levels followed by candle closes back inside the range often signal false breakouts. The wick represents the liquidity grab, while the close back inside shows the move was rejected.
Breaking Multiple Levels Rapidly
When price accelerates through several resistance levels in minutes without pausing, it may be a "overextension" that will quickly reverse. Sustainable breakouts typically break one level, consolidate briefly, then continue. Vertical moves breaking multiple levels often reverse sharply.
News-Driven Spikes
Breakouts occurring on surprise news announcements or economic data releases can be false breakouts as the initial reaction often overshoots before price settles at a more reasonable level. The immediate spike traps breakout traders before the reversal.
How to Trade Around False Breakouts
Wait for Confirmation
Rather than entering immediately when price breaks a level, wait for confirmation. This might be a candle close beyond the level, a successful retest of the broken level from the other side, or continuation after a brief pause. Patience filters many false breakouts.
Watch for Retests
After a genuine breakout, price often returns to test the broken level, which should now act as support (after breaking resistance) or resistance (after breaking support). If the retest holds, it confirms the breakout. If price pushes back through the level, the breakout was false.
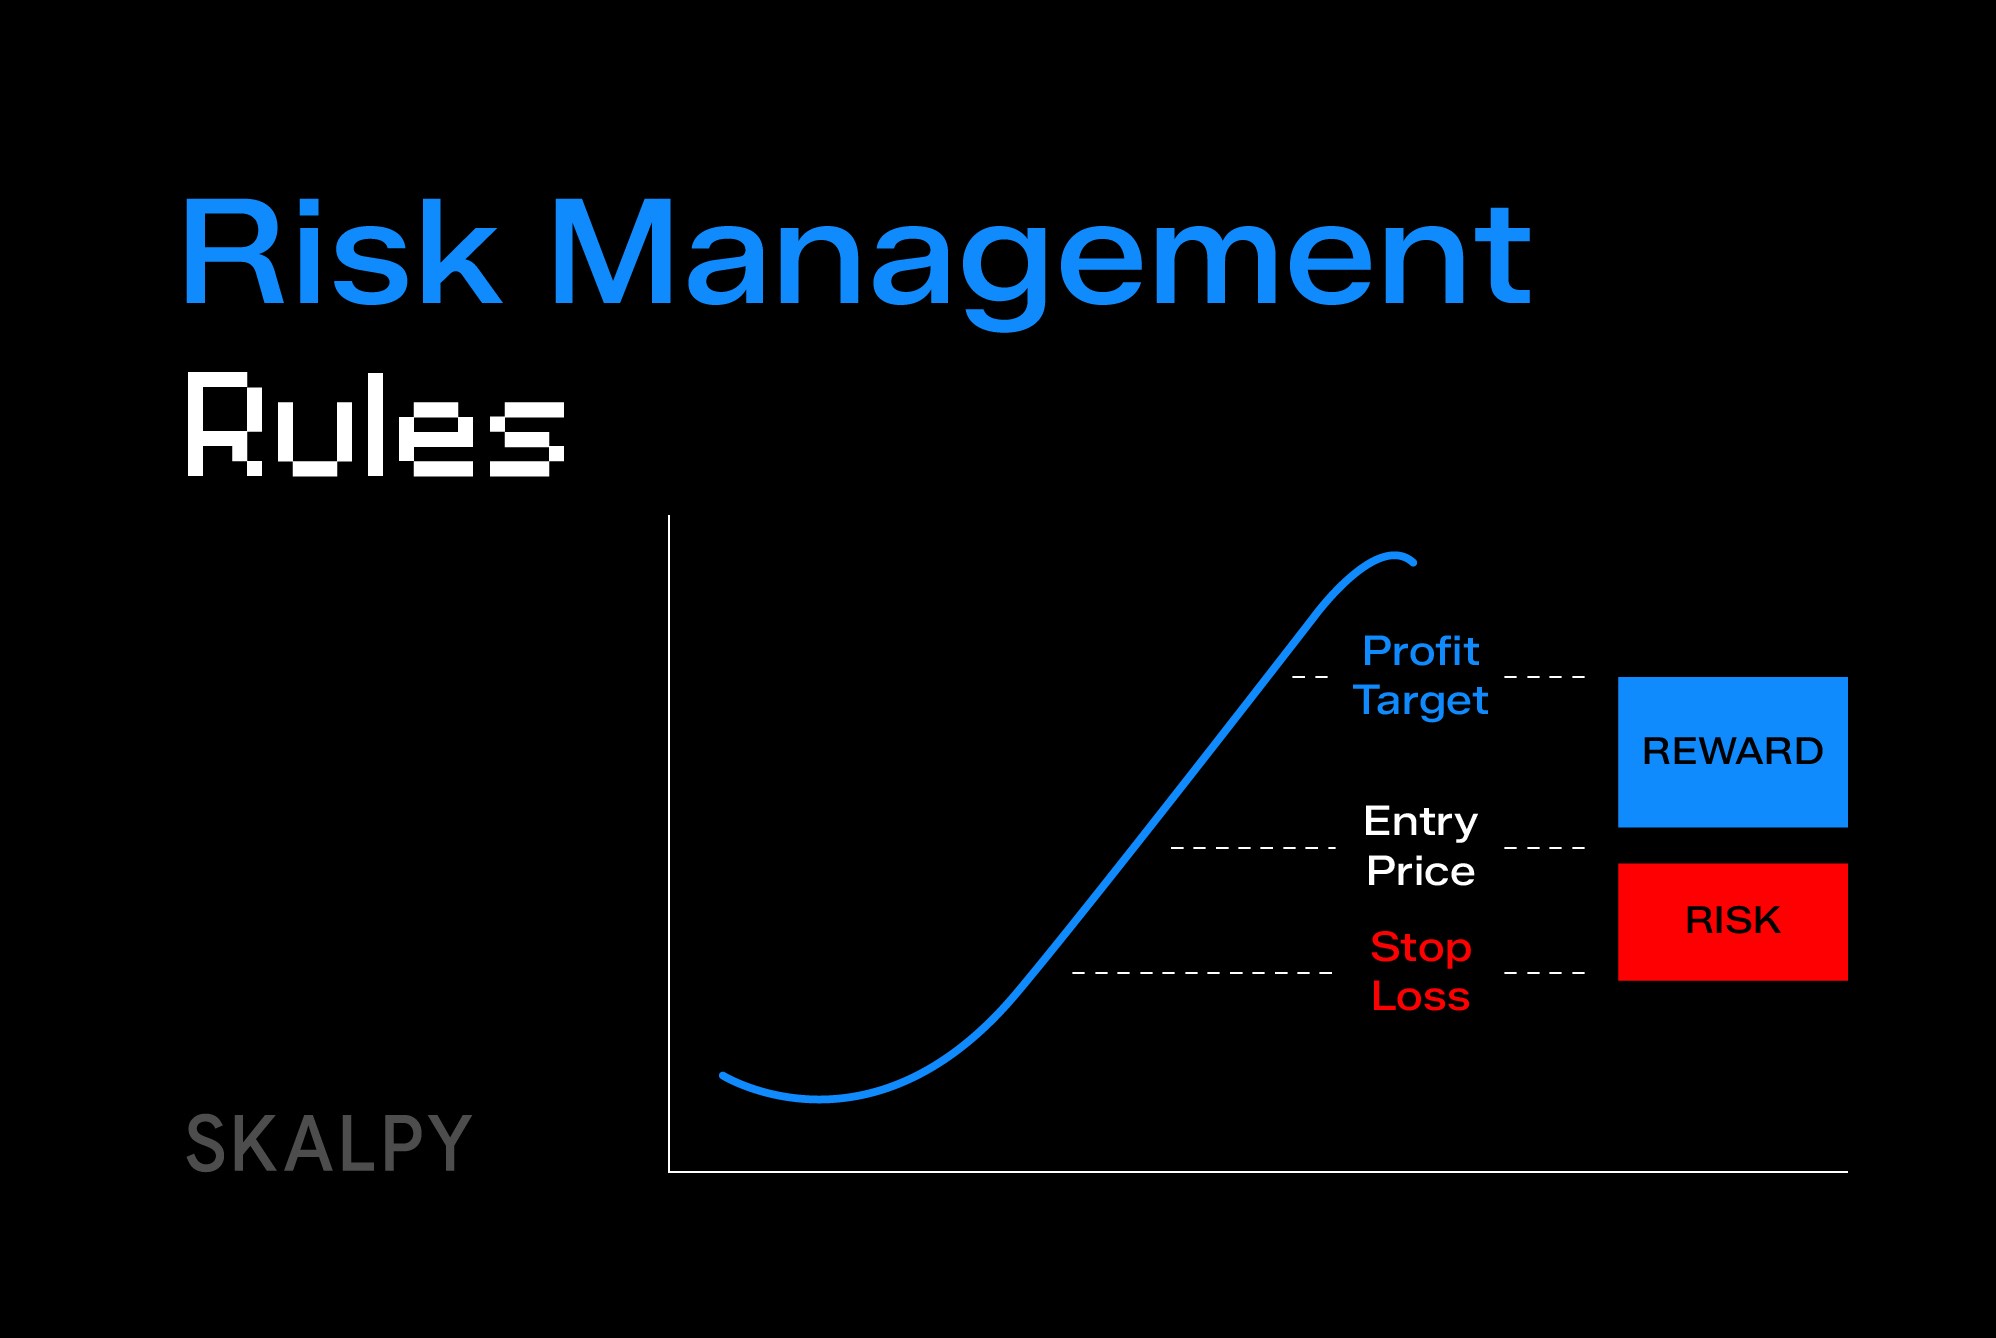
Use Smaller Position Sizes on Breakouts
If you trade breakouts, use smaller position sizes than your typical trades. This manages risk since breakouts have higher failure rates than continuation trades within established trends. Scale into positions after confirmation rather than going full size immediately.
Consider Fading Obvious Breakouts
Experienced traders sometimes fade (trade against) obvious breakouts at commonly watched levels, especially when volume is low or the move appears overstretched. This contrarian approach profits from the reversal but requires careful risk management.
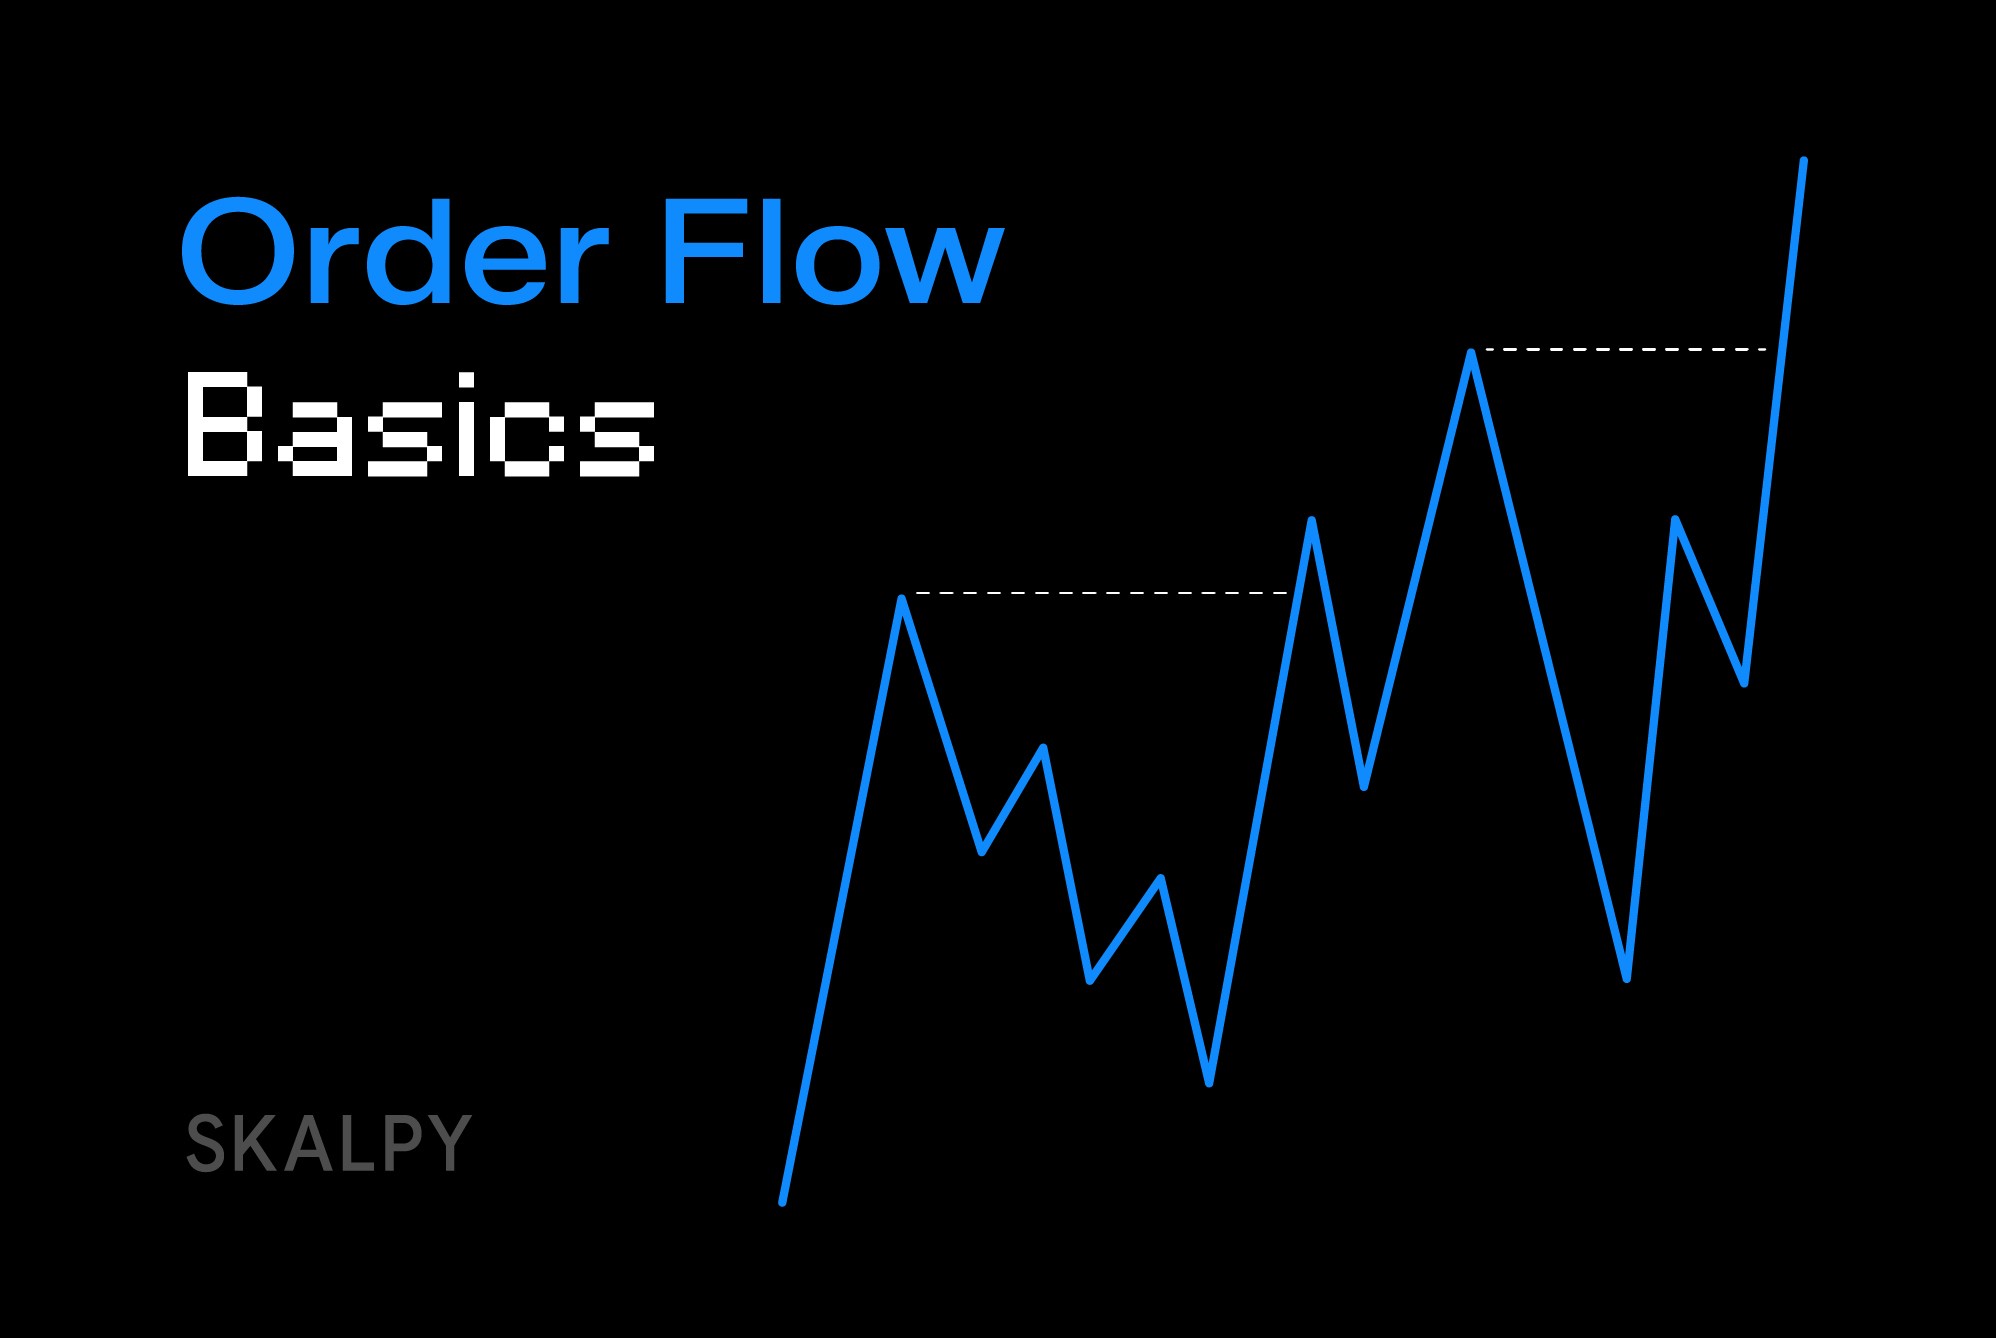
Monitor Order Flow
For scalpers using platforms like Skaply, monitoring real-time order flow and Level 2 data can reveal whether the breakout has genuine participation or is just a quick liquidity grab. Large orders supporting the breakout direction suggest authenticity, while thin order flow suggests a fakeout.
False Breakout Patterns in Crypto
Cryptocurrency markets are particularly prone to false breakouts due to lower liquidity compared to traditional markets and significant whale activity.
Round Number Fakeouts
Psychological levels like Bitcoin $30,000 or Ethereum $2,000 frequently see false breakouts. These obvious levels attract stops and pending orders, making them prime targets for liquidity grabs before the real move.
Low Liquidity Period Traps
False breakouts occur more frequently during low liquidity periods like weekends or late night hours when it takes less capital to push price through levels. These moves often reverse once major market participants return.
Exchange-Specific Fakeouts
On smaller exchanges with limited liquidity, false breakouts happen more easily. The same level might hold on Binance while breaking briefly on a smaller exchange. This is why trading on high-liquidity exchanges matters.
Combining False Breakouts with Other Analysis
Market Structure Context
Consider the broader market structure. A breakout that aligns with the larger timeframe trend has higher success probability than one fighting against the main trend. False breakouts often occur when trying to break against the dominant trend.
Multiple Timeframe Analysis
Check higher timeframes. A breakout on a 5-minute chart might be meaningless noise when the 1-hour chart shows clear range-bound structure. Genuine breakouts typically show agreement across multiple timeframes.
Support and Resistance Quality
Consider how many times a level has been tested. Levels tested multiple times without breaking become stronger, making eventual genuine breakouts more reliable. First-touch breakouts have higher false breakout rates.
Psychology of False Breakout Trading
False breakouts trigger emotional responses that compound losses if not managed properly.
FOMO Drives Bad Entries
Seeing price break out creates fear of missing the move. This FOMO drives impulsive entries without proper confirmation, leading to getting caught in false breakouts repeatedly.
Revenge Trading After Fakeouts
Getting stopped out by a false breakout creates frustration and desire to immediately re-enter. This revenge trading mindset often leads to taking the opposite side too aggressively, potentially getting caught if price whipsaws again.
Pattern Recognition Bias
After experiencing several false breakouts, some traders become overly cautious and miss genuine breakouts. Balance is required: be skeptical enough to avoid fakeouts but not so cynical that you miss real opportunities.
The Bottom Line
False breakouts are a natural part of market behavior, not anomalies to be frustrated by. They serve functions in market mechanics: clearing weak hands, providing liquidity, and creating conditions for sustained moves.
Rather than trying to avoid false breakouts entirely, focus on managing their impact. Use confirmation signals before entering, size positions appropriately, place stops logically, and maintain emotional discipline when fakeouts occur. Understanding that false breakouts will happen allows you to prepare for them rather than being surprised and emotionally reactive.
For active traders and scalpers, recognizing false breakout patterns becomes a skill developed through experience and screen time. The ability to differentiate between genuine breakouts with follow-through potential and liquidity grabs that will quickly reverse is what separates consistently profitable traders from those who keep getting trapped at exactly the wrong moments.