Технический анализ
Bullish Pennant Pattern: Comprehensive Trading Guide
18 дек. 2025 г.
автор:


Introduction to the Bullish Pennant
Technical traders rely on chart formations to identify potential market movements. Among these, the bullish pennant stands out as a pattern that suggests an upward trend may continue after a brief pause. This formation emerges when price action consolidates following a strong upward move, creating a distinctive shape that resembles its namesake.
Pattern Structure and Formation
Core Elements
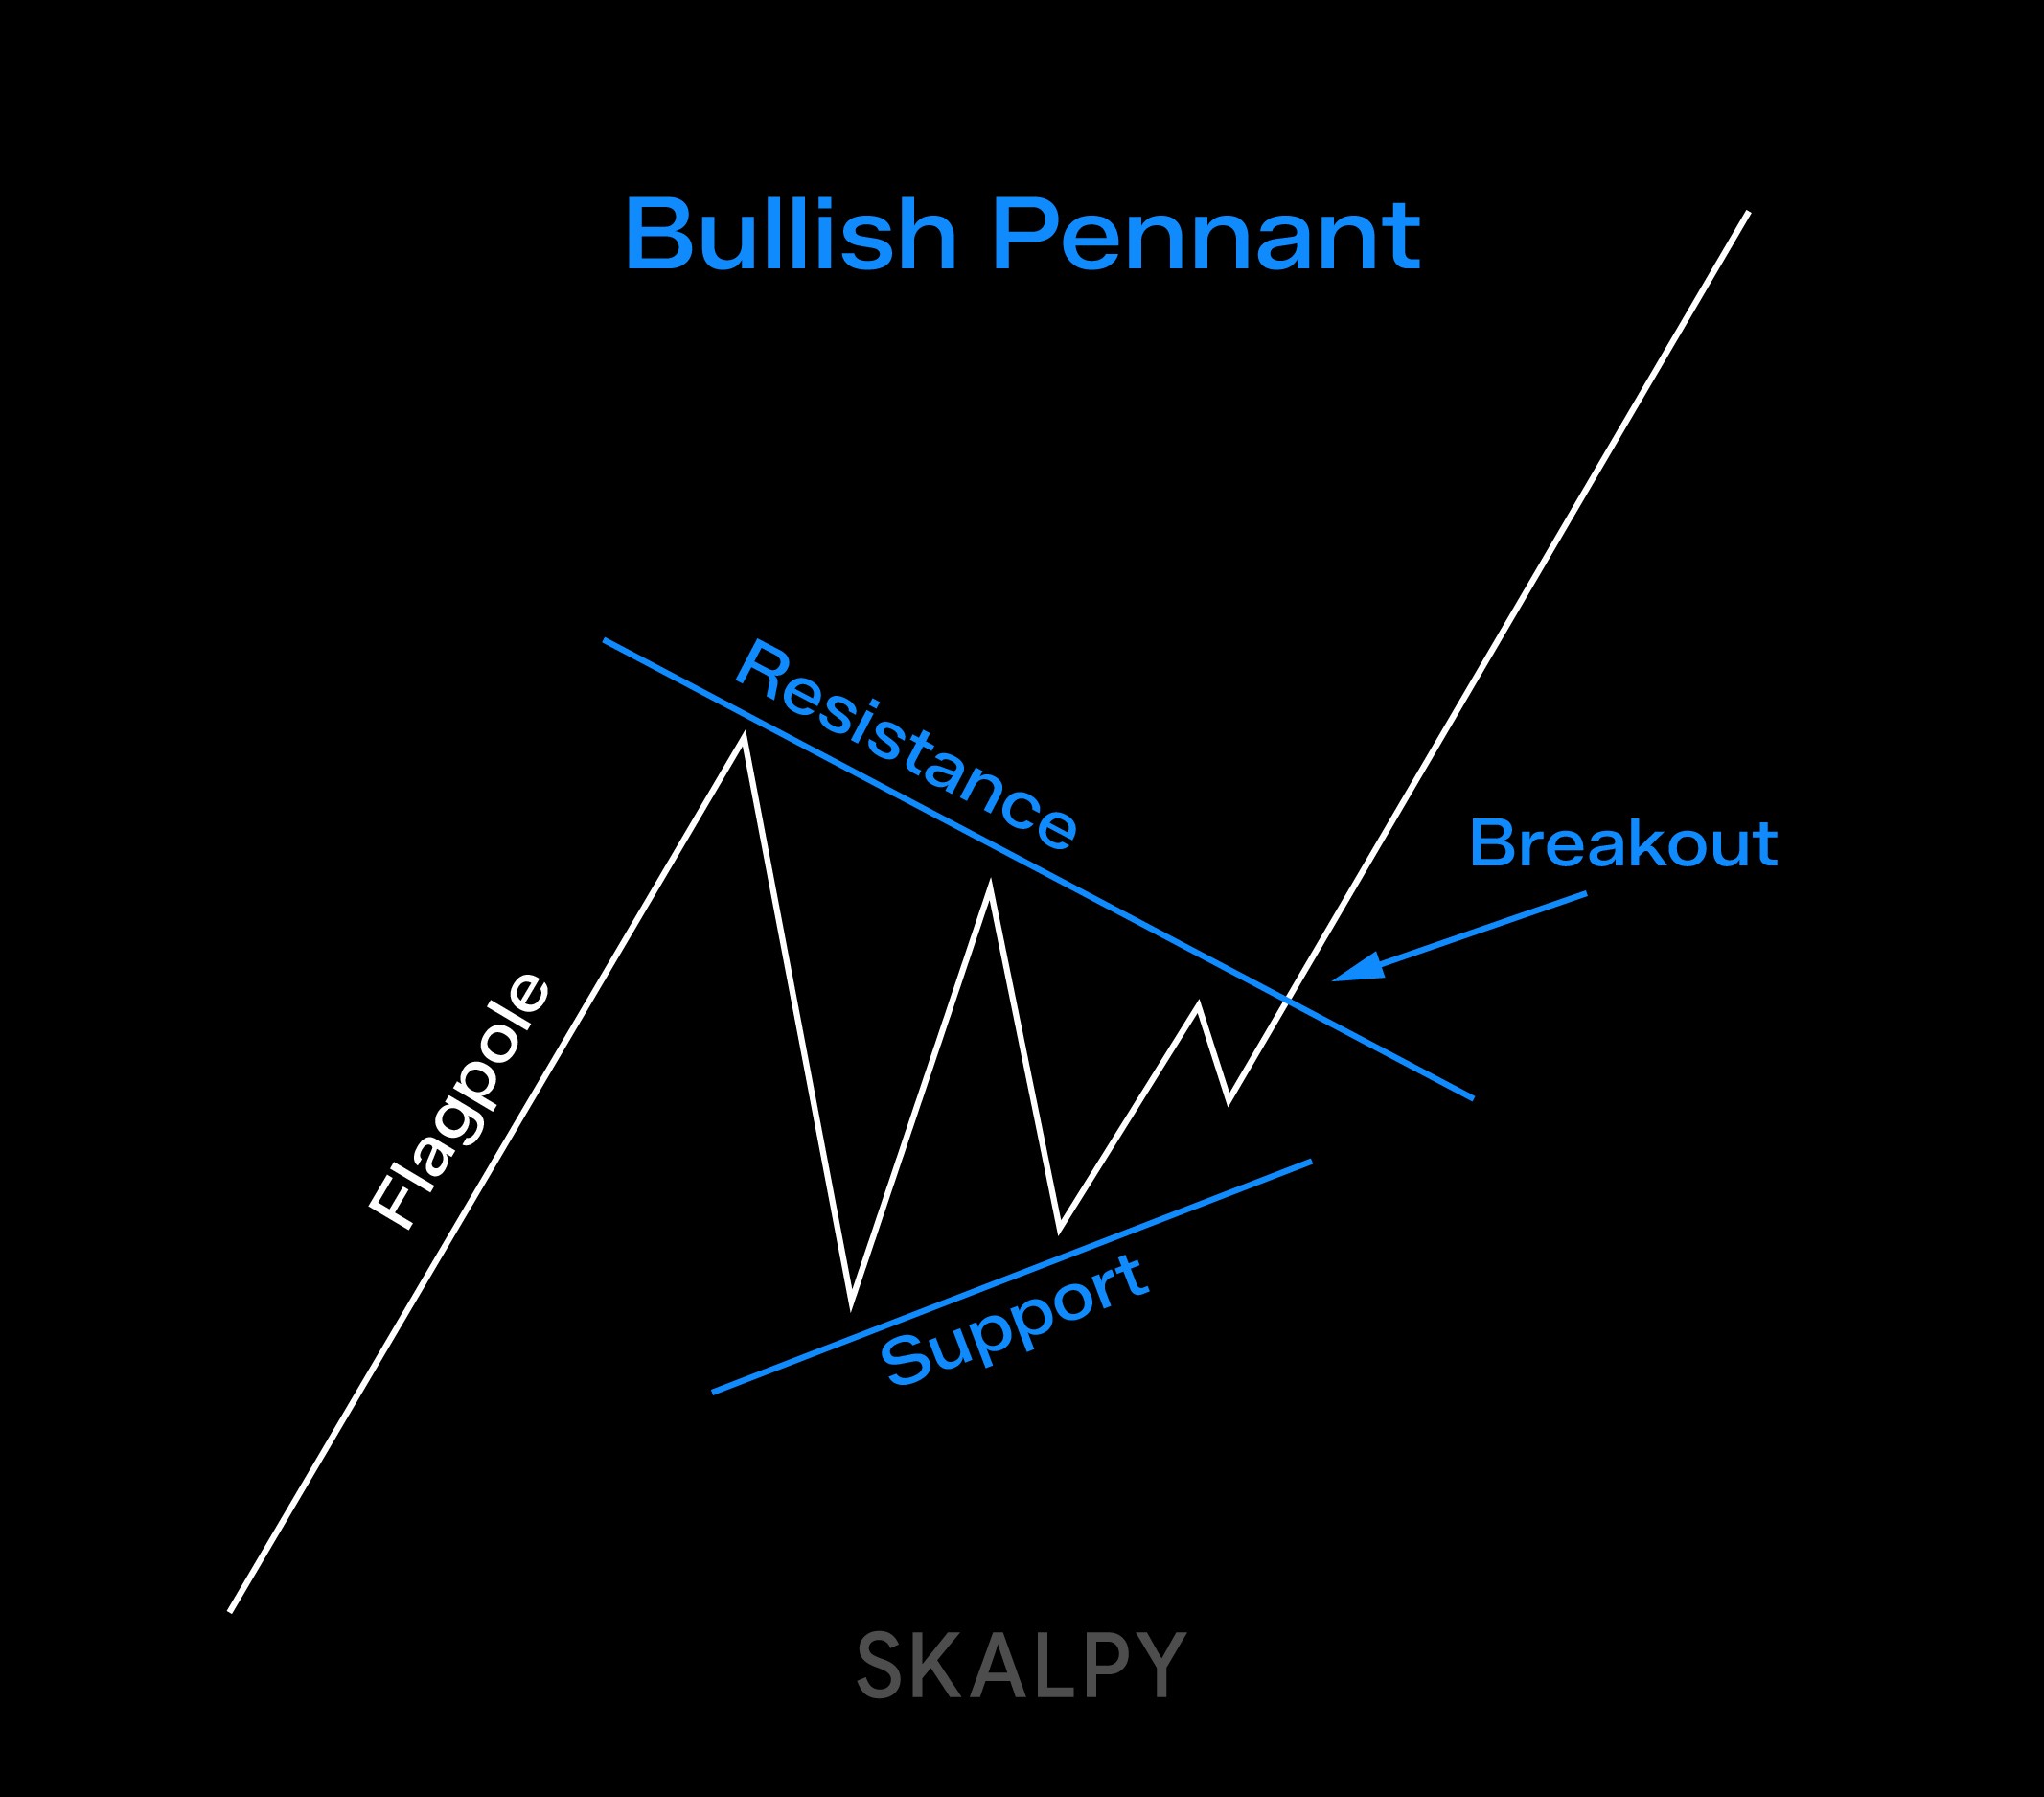
Three primary components define this pattern. First, a sharp vertical price increase creates what traders call the "flagpole." This represents the initial momentum surge, often triggered by news events or sudden market sentiment shifts. Second, a consolidation phase follows where price movements narrow into a triangular shape, bounded by converging support and resistance trendlines. Finally, a breakout above the upper boundary signals potential continuation of the upward movement.
Visual Characteristics
The ideal formation features a nearly vertical flagpole, indicating strong buying pressure. The consolidation triangle should be relatively tight, with support and resistance lines drawing closer together. This compression suggests decreasing volatility before the next potential move.
Market Psychology
Understanding why this pattern forms helps explain its reliability. After a sharp price move, some buyers hesitate to enter at higher levels, especially if they missed the initial breakout. At the same time, early participants may start taking profits. Sellers also step in, either expecting a short-term pullback from stretched conditions or looking for signs of a broader reversal. The interaction between profit-taking and ongoing demand is what leads to the consolidation phase.
Trading Methodology
Entry Strategies
Traders employ several approaches for entering positions. Some place buy orders slightly above the resistance trendline, while others wait for the price to exceed the most recent high within the pattern. For those looking to execute these strategies efficiently, platforms like Skaply, a fastest cross-platform trading terminal, provide tools designed to help traders identify and act on such patterns in real-time across multiple markets. Conservative traders prefer waiting for a candle to close definitively above resistance or even for a retest of the breakout level, which can provide additional confirmation but risks missing the move.
Risk Management
Stop-loss placement typically involves two methods. The first positions the stop below the support trendline, while the second places it beneath the lowest point within the consolidation range. Both approaches offer protection while allowing room for normal price fluctuations.
Profit Targets
The traditional calculation measures the flagpole's height and projects that distance upward from the breakout point. This assumes the next impulse will match or exceed the initial one. Alternatively, trailing stops let profitable positions run while protecting against reversals.
Volume Analysis Enhancement
Volume plays a crucial role in validating breakouts. Genuine breakouts typically show increased trading activity, while false breakouts often lack volume confirmation. A surge in volume during the resistance breakthrough suggests institutional participation and increases the probability of continuation.
Market Profile indicators can enhance analysis by identifying value areas and volume concentrations. The Point of Control within the pennant can serve as a reference for stop placement, while breakouts from Value Area High or Low levels may provide additional entry signals.
Real-World Applications
Short-Term Trading
This pattern appears across multiple timeframes, making it suitable for intraday trading. On shorter intervals like 15-minute charts, patterns can form and resolve within a single trading session. However, traders must remain aware that patterns on smaller timeframes carry higher risk of false signals.
Multi-Market Relevance
The formation appears in equities, futures, and cryptocurrency markets. Gold futures, stock index futures, and major cryptocurrencies all exhibit this pattern regularly, particularly during periods of heightened market activity or news-driven volatility.
False Breakout Recognition
Not all breakouts succeed. False breakouts occur when price briefly exceeds resistance but quickly reverses. Delta indicators can reveal this failure by showing positive delta (buying pressure) followed immediately by extreme negative delta, suggesting sellers overwhelmed buyers despite initial strength.
Footprint charts provide granular detail, displaying individual trade clusters. When large buying clusters fail to push prices higher, or when prices close near lows despite apparent buying interest, these signs indicate buyer inefficiency and potential reversal.
Pattern Comparisons
Bullish Flag vs. Bullish Pennant
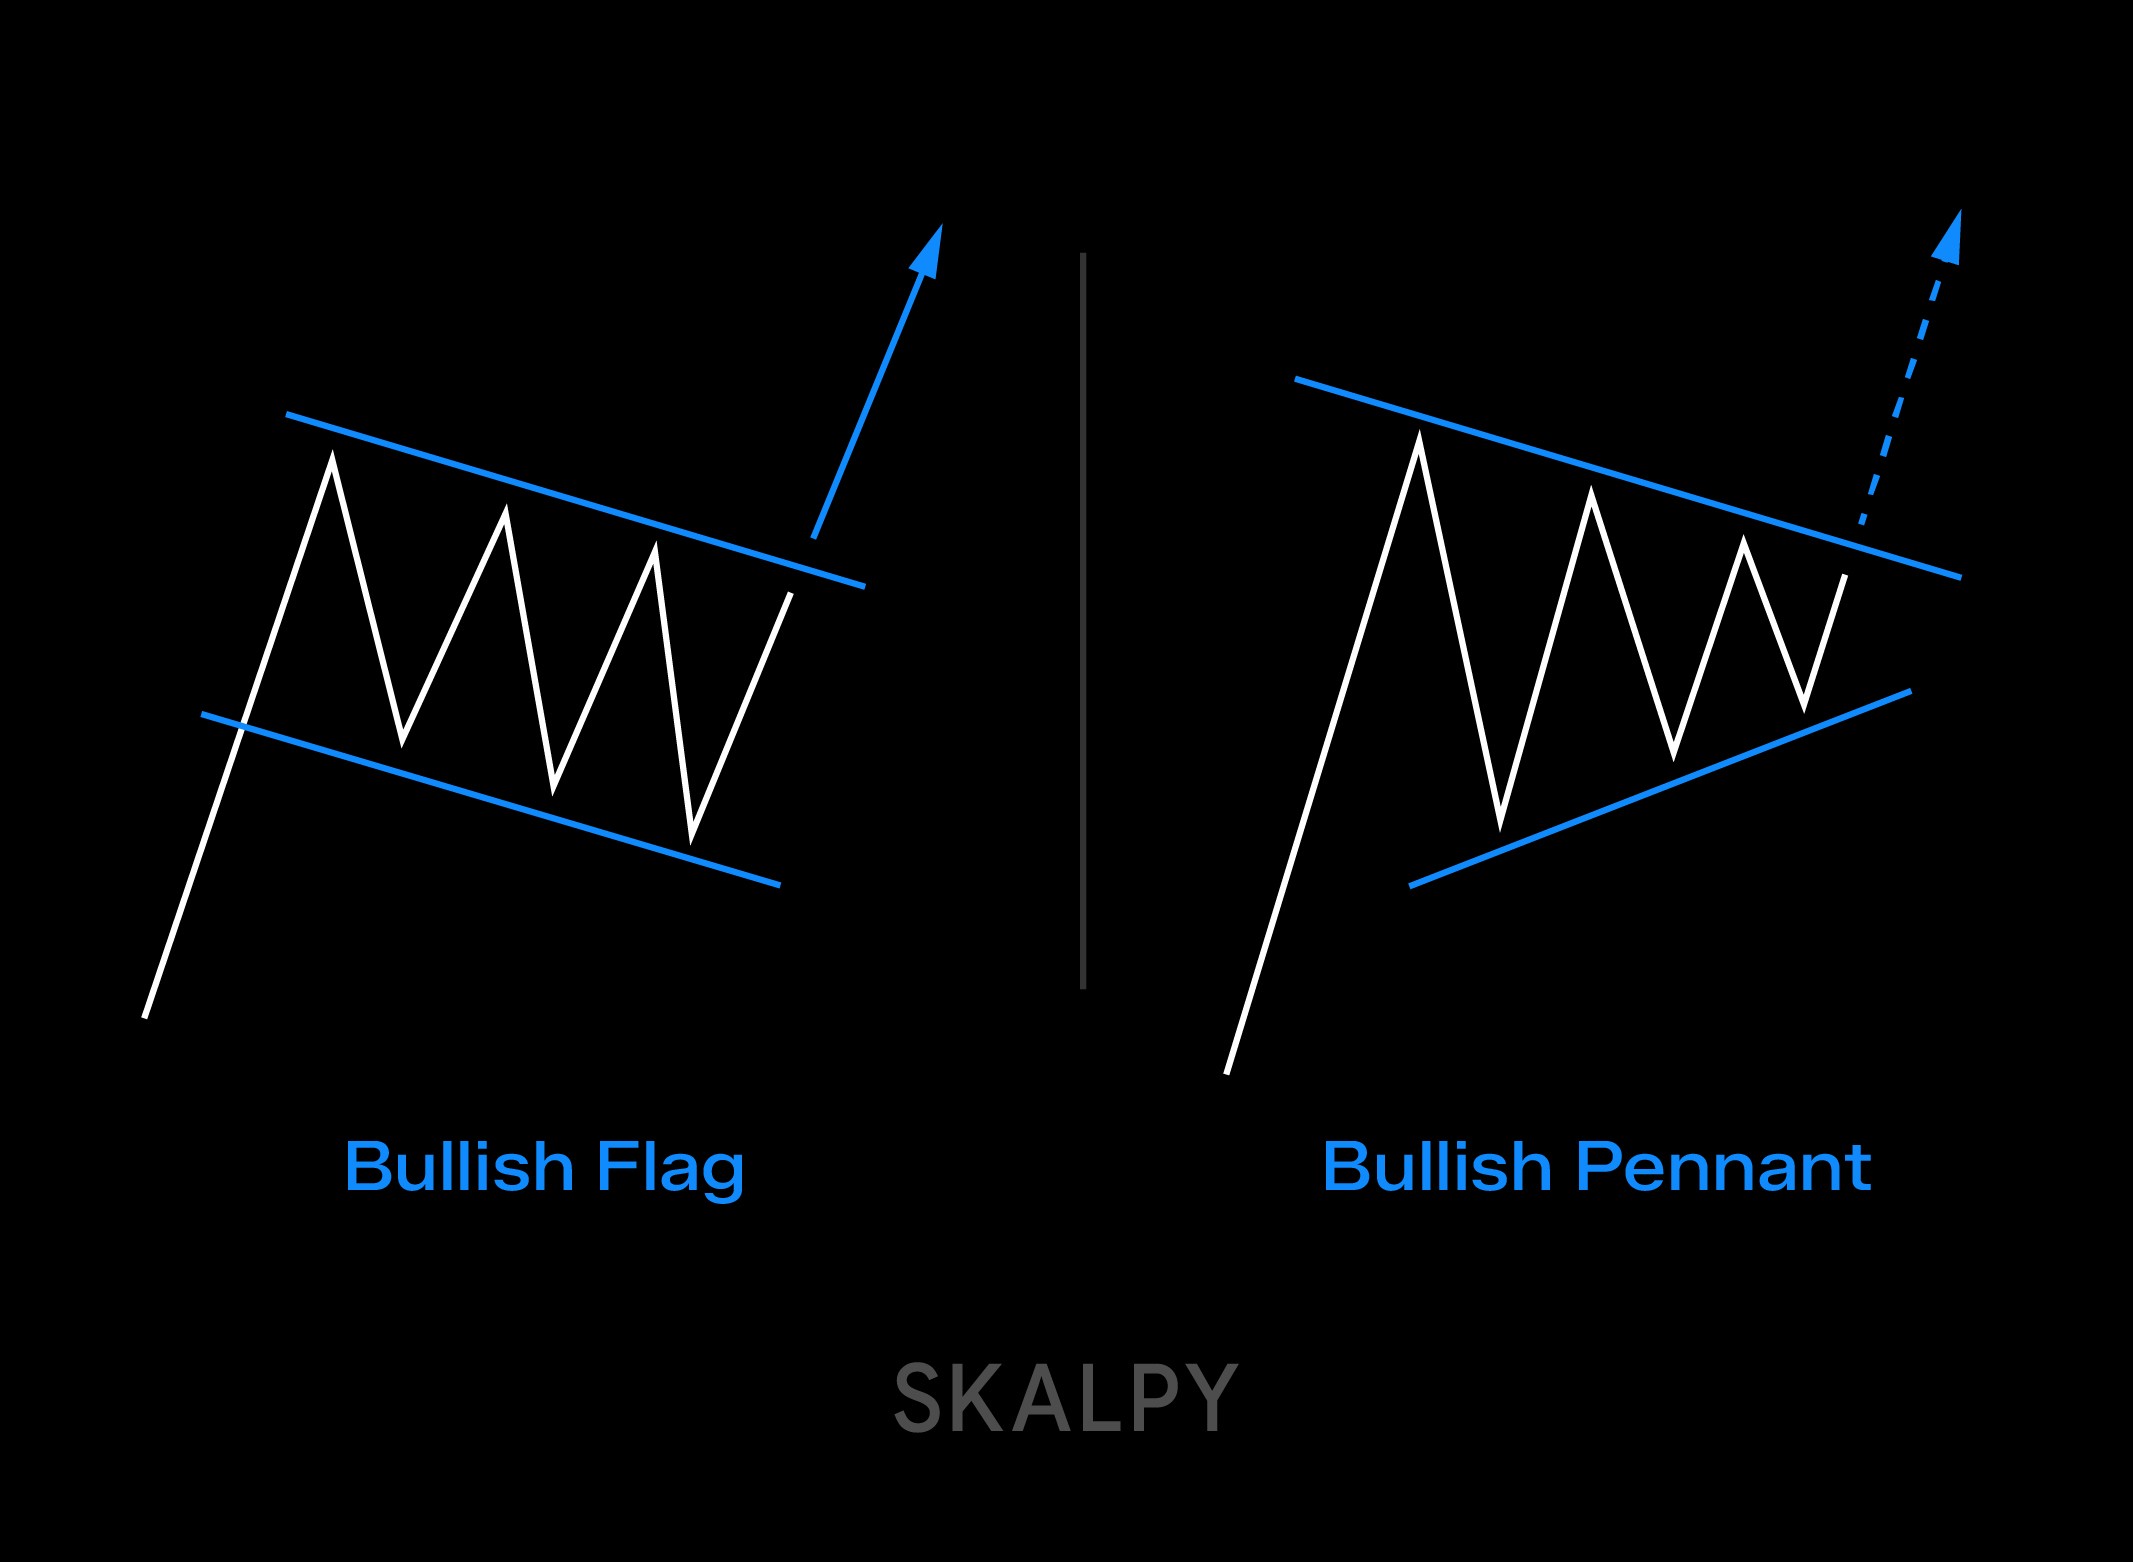
Both patterns signal continuation after consolidation, and both use the flagpole measurement for target calculation. The key difference lies in consolidation shape: flags show parallel support and resistance lines, while pennants display converging lines forming a triangle.
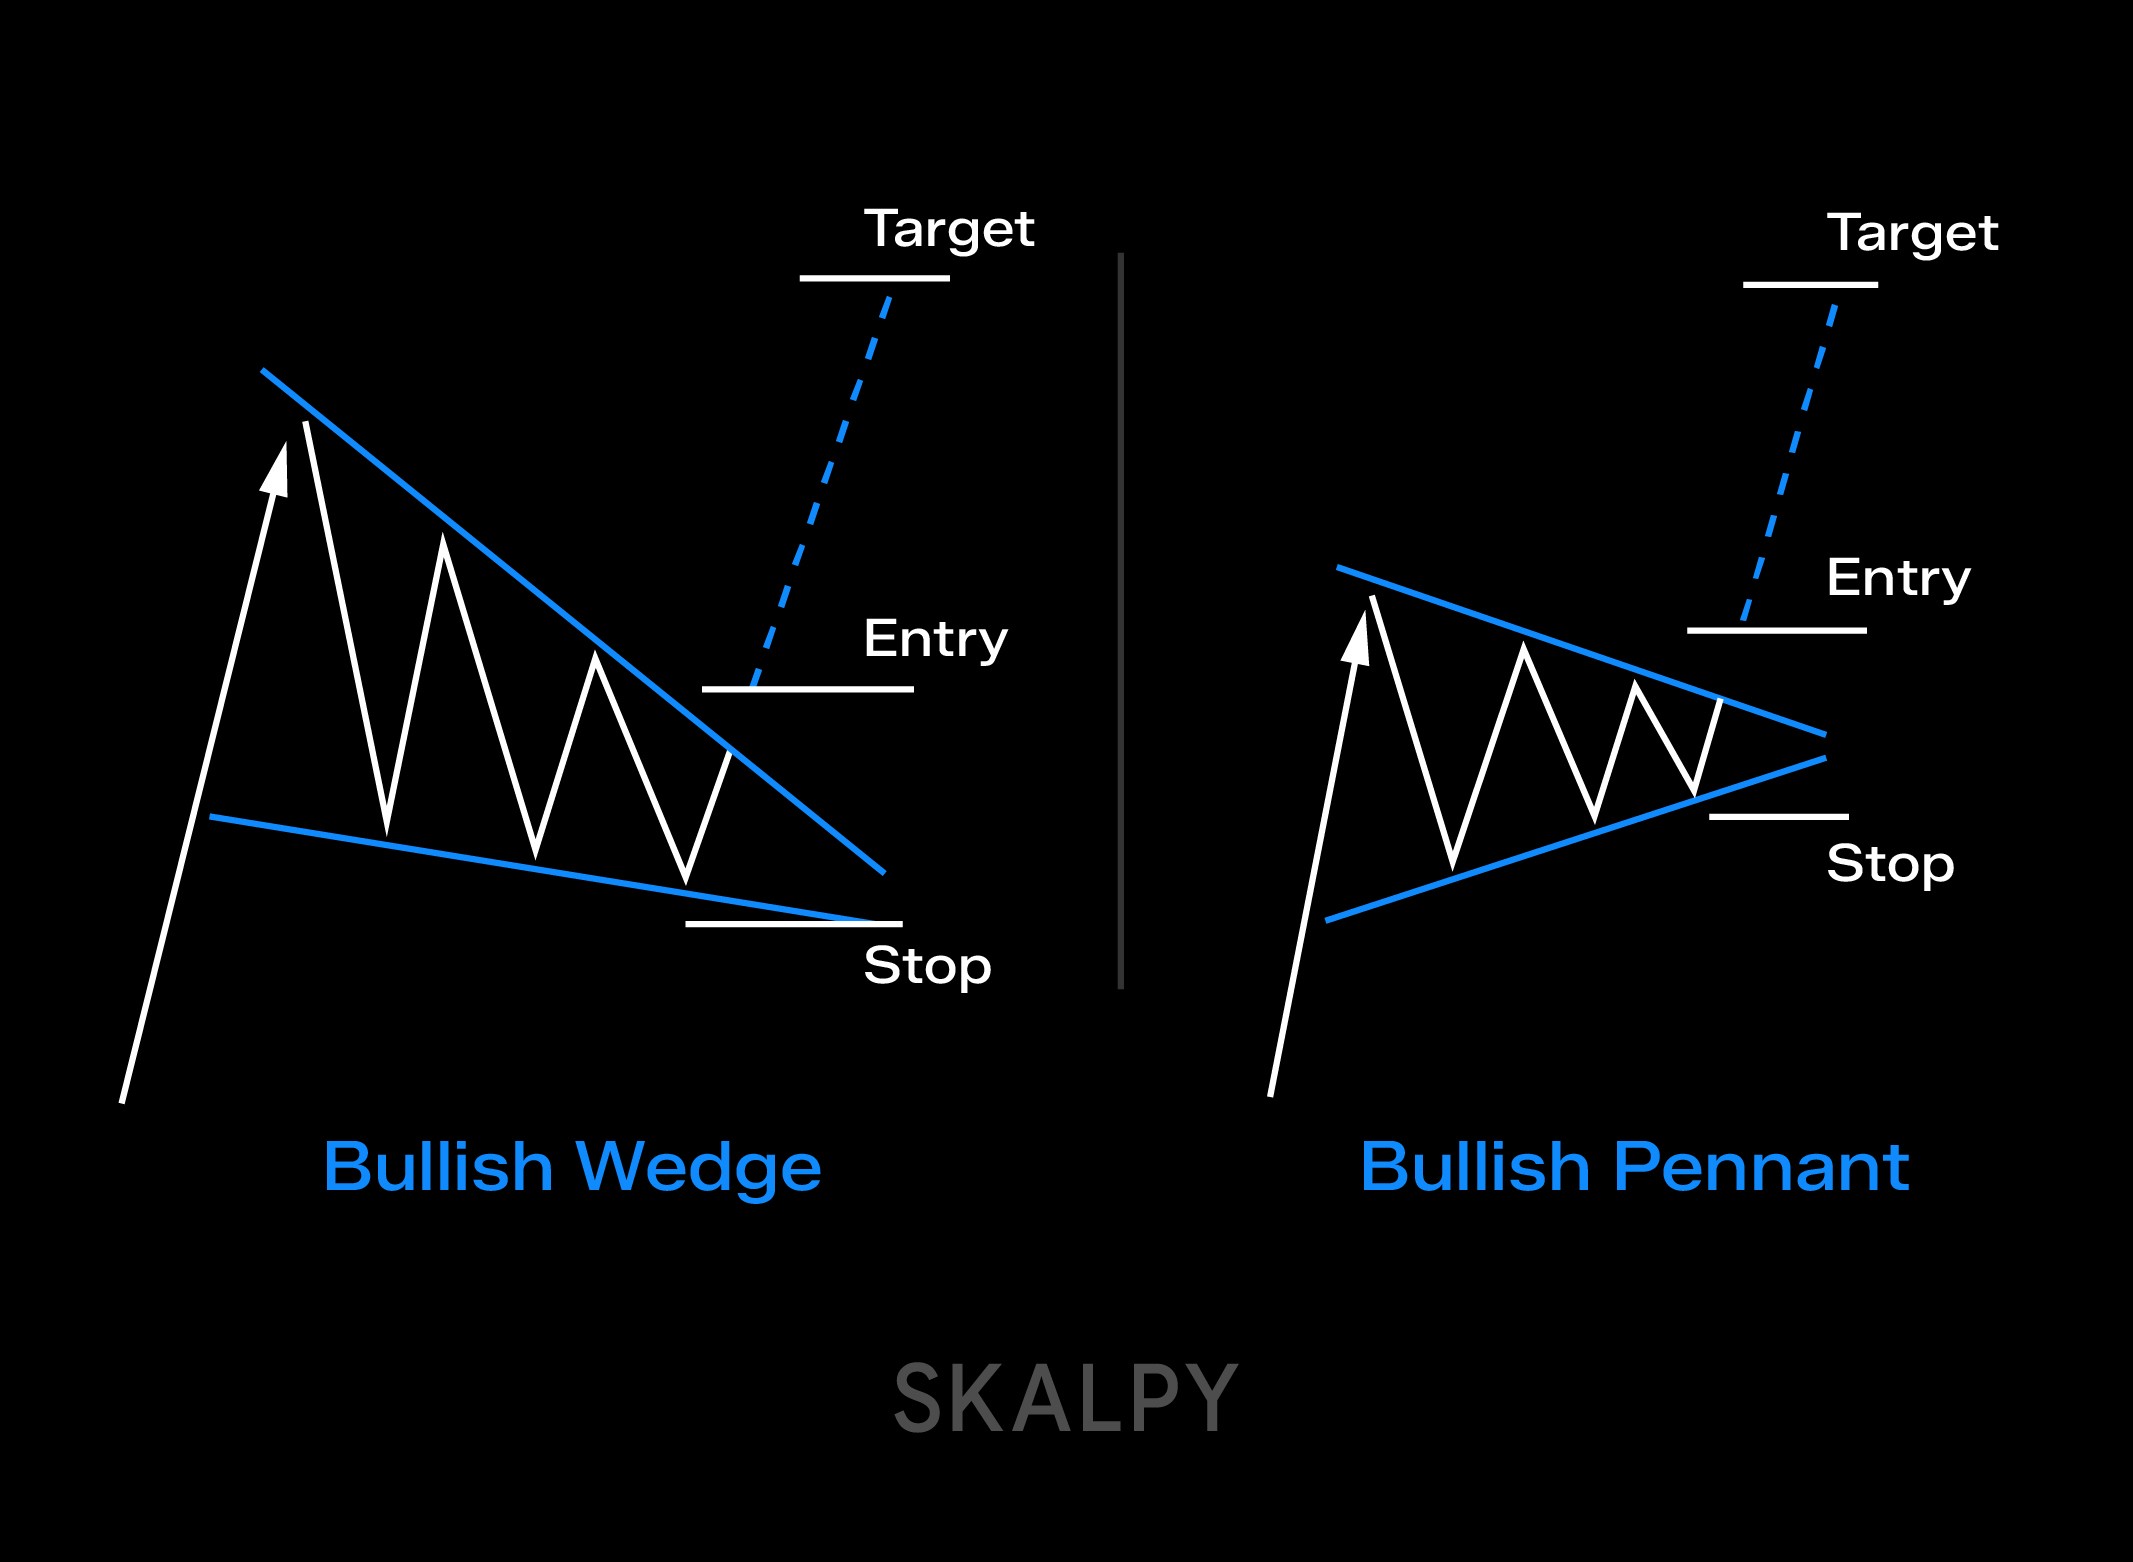
Pennant vs. Wedge
Wedges also feature converging trendlines, but their orientation differs. In pennants, the lines converge symmetrically around a horizontal axis. Wedges tilt either upward (ascending wedge, often bearish) or downward (descending wedge, often bullish), with different implications for price direction.
Bearish Pennant
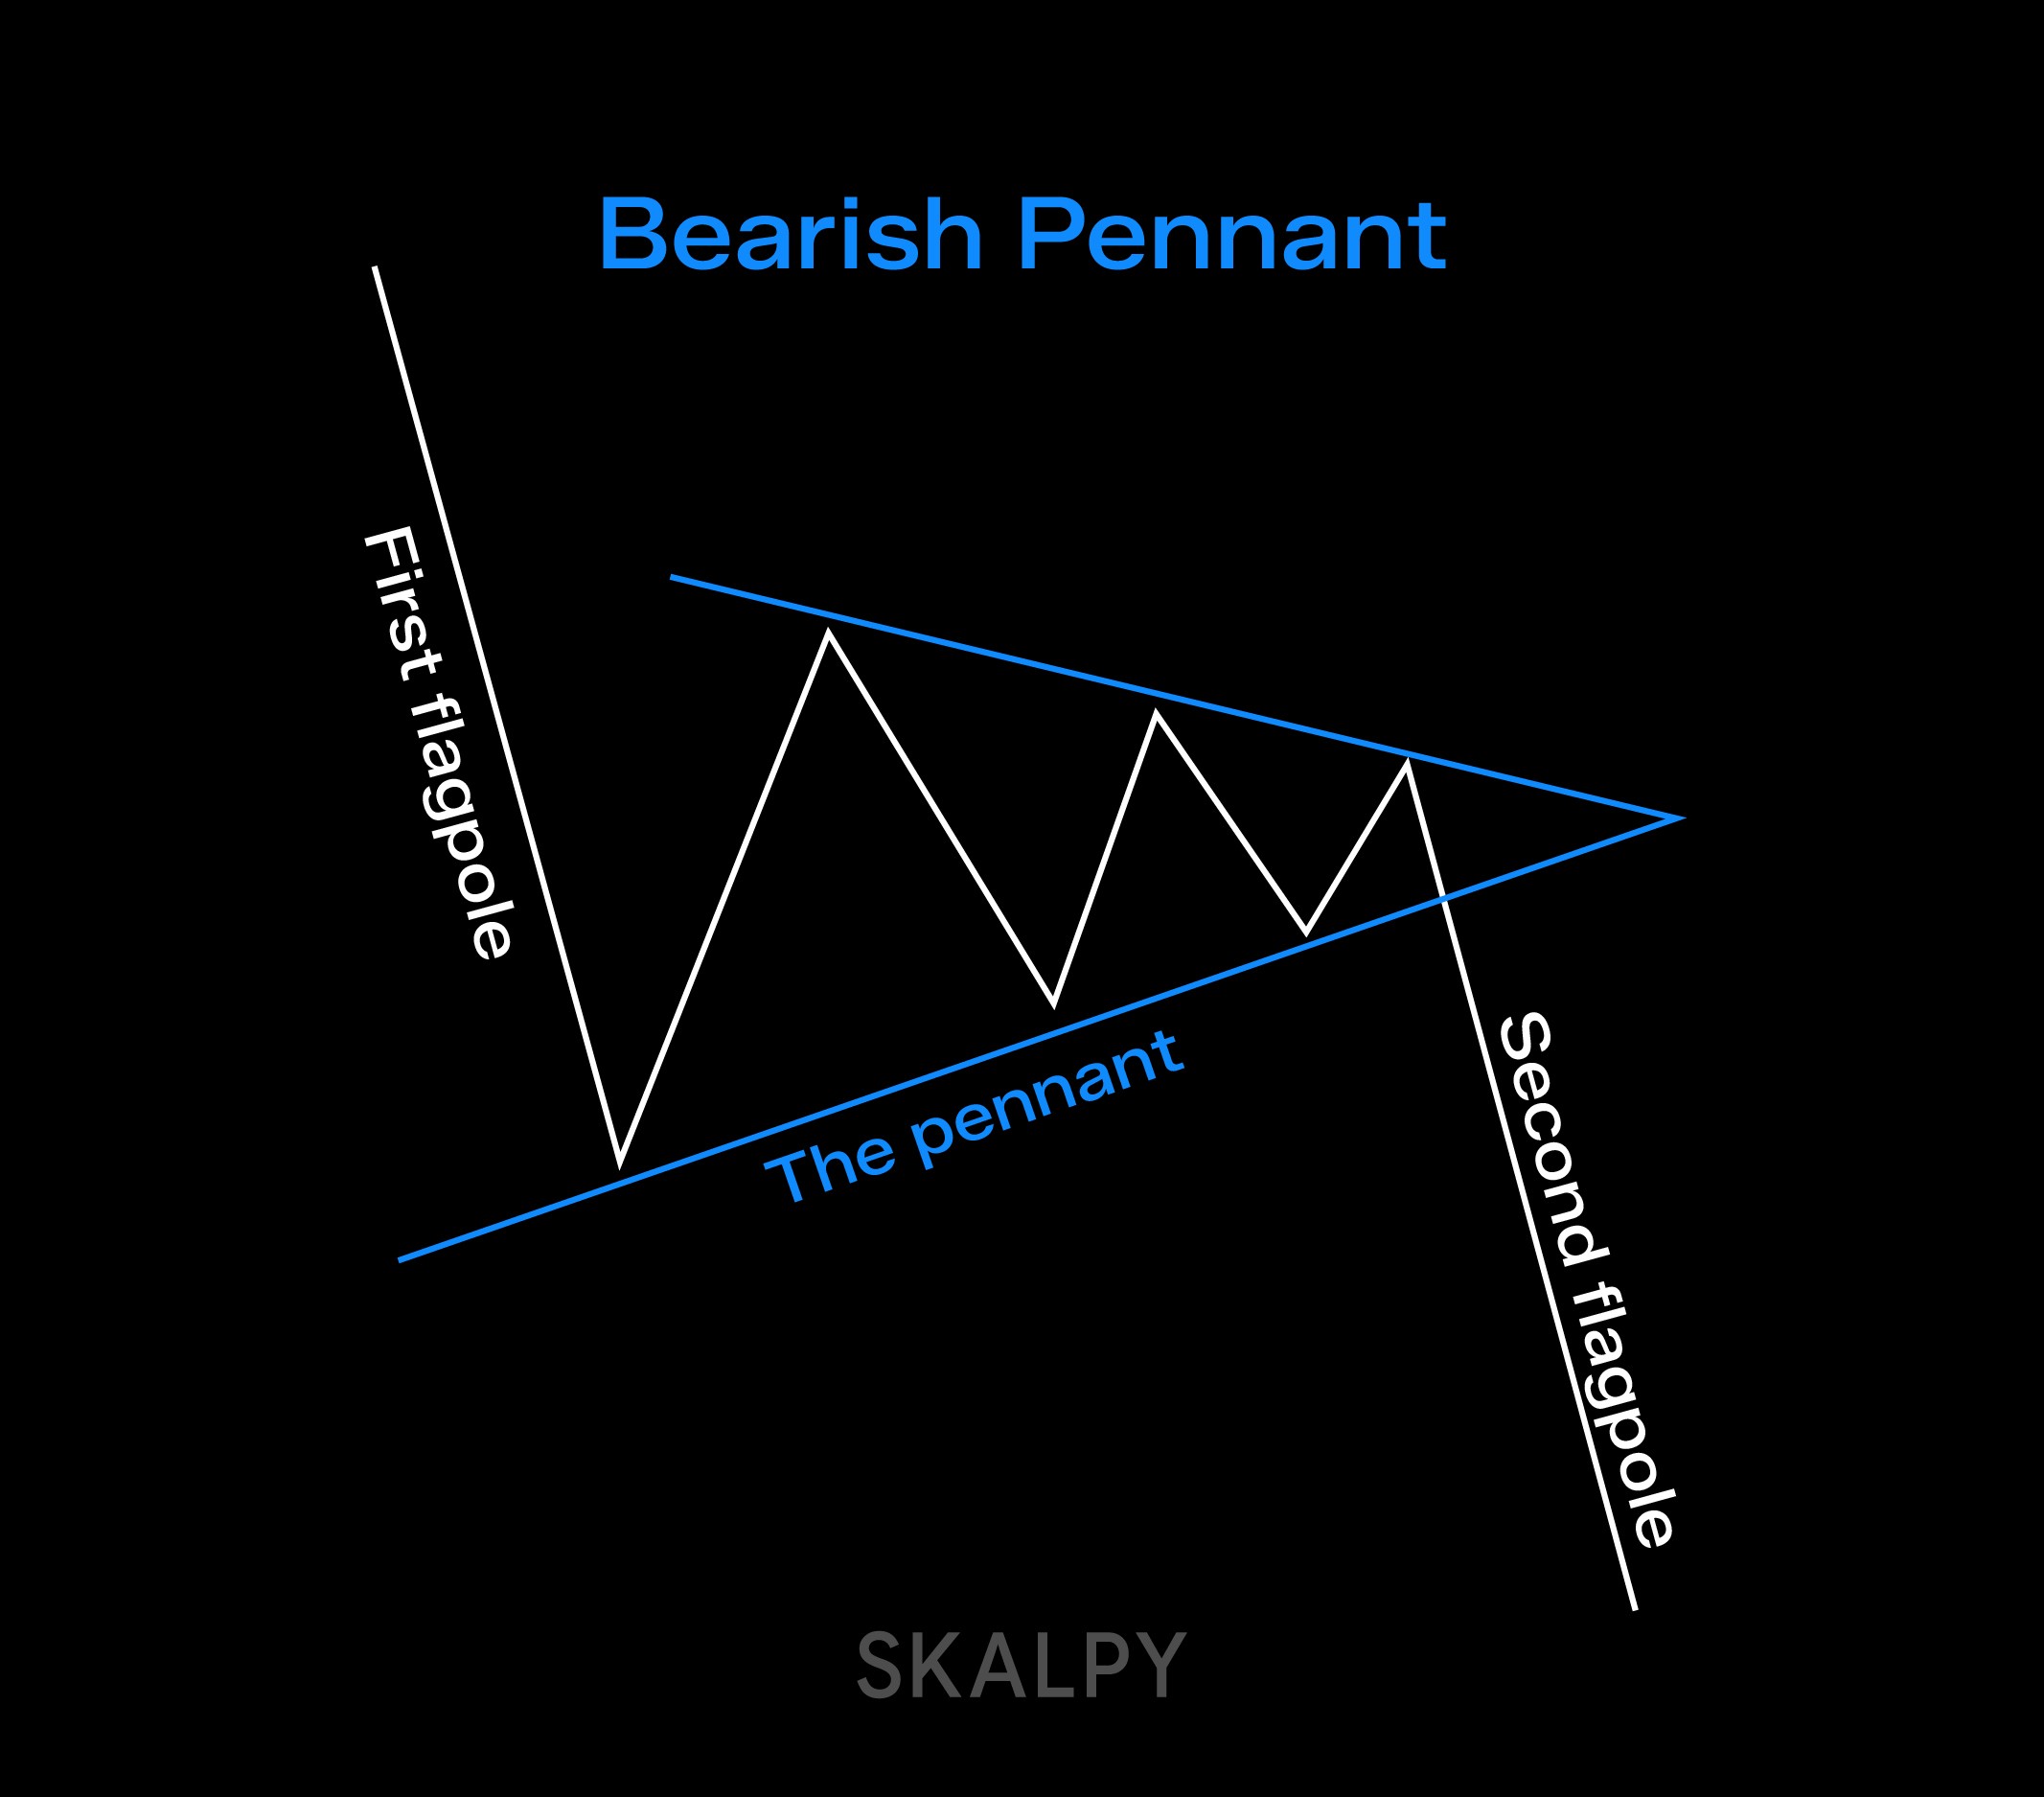
The bearish version mirrors its bullish counterpart. It forms during downtrends, with a downward flagpole followed by triangular consolidation, potentially signaling continuation of the decline after breakout below support.
Success Rates and Practical Considerations
Research by analyst Thomas Bulkowski suggests upward breakouts succeed approximately 54% of the time, with roughly 35% of trades reaching calculated target levels. These statistics highlight the importance of proper risk management and realistic expectations.
The pattern works best in strong trending markets where consolidation represents a temporary pause rather than trend exhaustion. Effectiveness decreases during periods of high uncertainty, low liquidity, or when the broader market context contradicts the signal.
Common Pitfalls
Traders face several challenges. Identifying resistance and support lines involves subjectivity, as price noise can make exact boundaries unclear. The pattern can fail during session endings when reduced liquidity prevents continuation. Additionally, trading near major news events or economic releases introduces unpredictability that can invalidate technical patterns.
Conclusion
The bullish pennant offers a clear framework for spotting potential trend continuation. It appears frequently across different markets and fits well with market rhythm, where price action naturally shifts between trending and consolidation phases. Because the consolidation is usually compact compared to the flagpole, the pattern often provides favorable risk-reward setups for technical traders.
However, limitations exist. Breakouts can fail, pattern identification requires judgment, and successful trading demands consideration of broader market context. Using volume analysis, delta indicators, and footprint charts can significantly improve decision-making. Ultimately, this pattern serves best as one component within a comprehensive trading strategy rather than a standalone signal. Traders seeking to implement these strategies can explore tools like Skaply, a crypto trading platform designed for pattern-based trading.


